

Arc Flash Risk Assessment for MV Switchgear
If you want one takeaway, it’s this: arc flash risk in 4.16 kV and 13.8 kV switchgear is driven by current, clearing time, and working distance - and a slower trip can make the hazard worse even when fault current is lower.
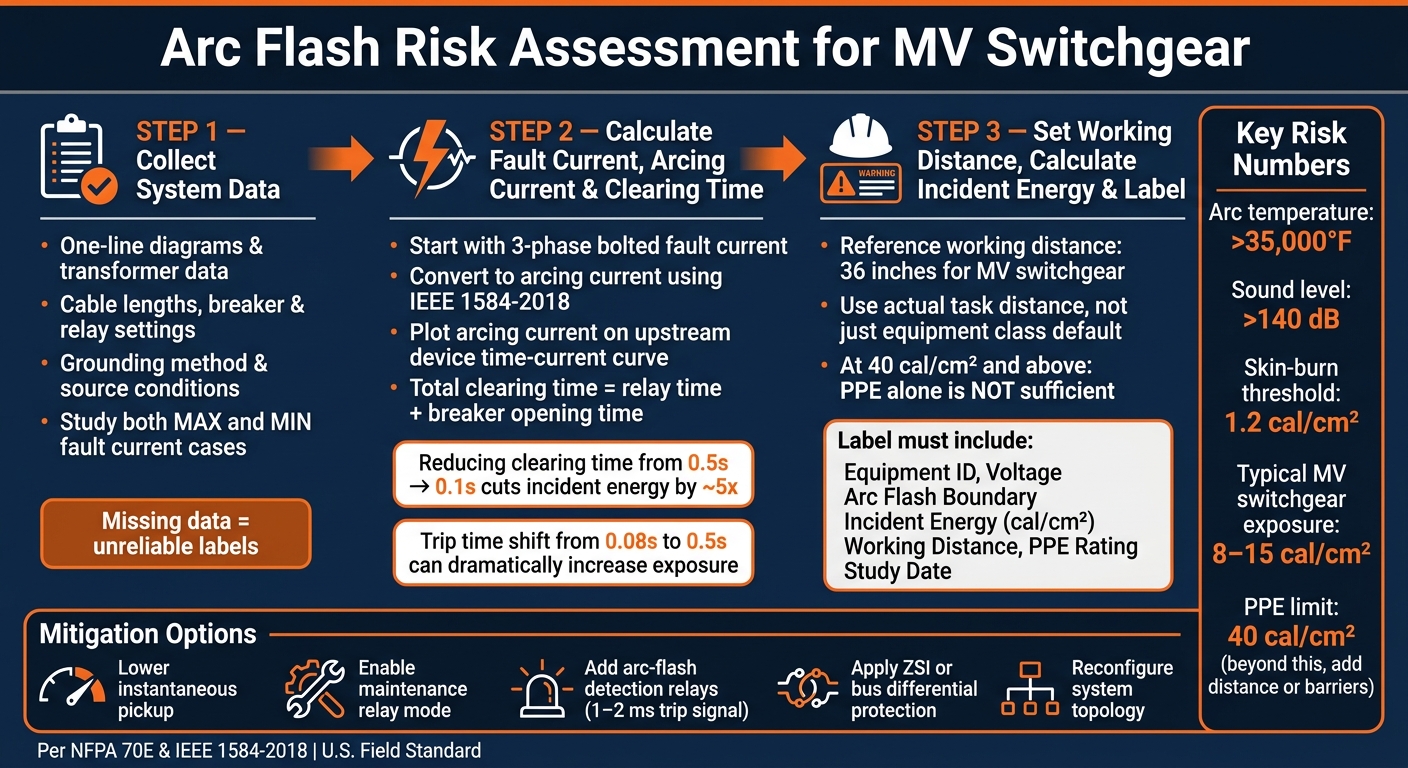
When I look at MV switchgear arc flash studies, I focus on a short chain of facts:
- Get current system data first.
- Check both max and min fault current cases.
- Base clearing time on arcing current, not bolted fault current.
- Use the worker’s actual distance, often around 36 in. for MV gear.
- Label each compartment with incident energy, arc flash boundary, PPE rating, voltage, equipment ID, and study date.
A few numbers frame the risk fast:
- Arc temperatures can exceed 35,000°F
- Sound can exceed 140 dB
- 1.2 cal/cm² is the skin-burn threshold used for the arc flash boundary
- MV switchgear often lands around 8 to 15 cal/cm² or more
- A trip time shift from 0.08 s to 0.5 s can push exposure much higher
- At 40 cal/cm² and above, PPE alone is not enough
Here’s the plain version: I start with one-lines, transformer data, cable lengths, breaker and relay settings, grounding, and all source conditions. Then I calculate bolted fault current, convert it to arcing current with IEEE 1584-2018, read the upstream device clearing time, apply the task distance, and turn that result into a field label. If the number is too high, I look at trip settings, maintenance mode, arc-flash relays, ZSI, bus differential, or lineup changes.
This article is a step-by-step guide to that process under NFPA 70E and IEEE 1584-2018, with a U.S. field focus and direct use for labeling, PPE, switching, and upgrade planning.
Arc Flash Risk Assessment for MV Switchgear: Step-by-Step Process
Step 1: Collect the Right System Data Before Running the Study
An arc flash study is only as good as the data behind it. If the inputs are off, then incident energy, PPE, and equipment labels will be off too. Before anyone runs calculations, the team needs a full, checked view of the system as it exists today. That means verifying the data that drives fault current, clearing time, and labeling. For buyers, this shows what they’re actually getting. For field teams, it sets the current operating limits.
Electrical Data Required for MV Switchgear Assessment
The main inputs are the same ones used for short-circuit and IEEE 1584 incident-energy studies. Fault current is the starting point, and each data point sharpens the result.
| Data Item | Why It Matters |
|---|---|
| Up-to-date one-line diagrams showing all switchgear lineups, transformers, cables, breakers, ties, generators, and major loads | Ensures each fault location is modeled correctly |
| Available fault current at the service entrance | Sets the starting point for bolted fault current at downstream MV buses |
| Transformer kVA, primary and secondary voltages, percent impedance, winding configuration, and X/R ratio where available | Determines how much current reaches the MV bus |
| Cable size, material, insulation, and actual length in feet | Affects impedance and available fault current at downstream buses |
| Switchgear bus voltage, continuous current rating, and short-circuit rating | Confirms the equipment rating is adequate for the calculated fault current |
| Breaker type and trip unit technology | Influences clearing time characteristics and available protection functions |
| Relay or trip unit model and settings, including pickup values, time-delay settings, and instantaneous settings | Directly controls clearing time at arcing current, one of the primary drivers of incident energy |
| Grounding method | Can change fault path and trip response |
If any of these values are missing or based on guesses, the study gets less certain. A small substitution can have a big effect. For example, if a transformer’s actual impedance isn’t known and a typical value is used instead, the calculated fault current at the bus may shift enough to change the incident energy result and the PPE category tied to it.
Operating Modes That Change the Results
Each operating mode needs its own model because fault current and clearing time can change with lineup, source path, and relay settings. Review these modes separately:
- Tie-breaker closed setups where two sources are paralleled
- Alternate utility feeds with different source impedances
- Generator-parallel or islanded operation
- Maintenance or reduced-energy relay modes that temporarily change trip settings
IEEE 1584 guidance says to study both maximum and minimum fault current cases. That’s because the highest incident energy does not always happen at the highest current. In some cases, a lower current causes a slower relay response, and that longer clearing time can produce more energy than a higher current with a fast trip.
For each mode, document:
- Which breakers are open or closed
- The calculated available fault current at each MV bus for that setup
- The clearing time of the upstream protective device at that current level
Using Equipment Records to Fill Data Gaps
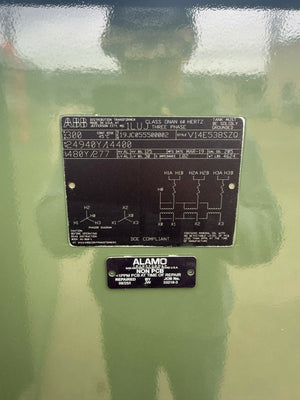
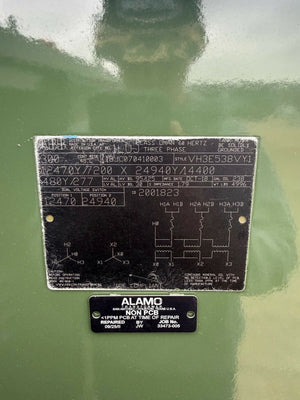
When records are incomplete, check the gear in the field before estimating anything. Older MV lineups often come with gaps in the paper trail. Nameplates may be painted over. Relay settings may have been changed in the field and never logged. Original procurement files may simply be gone. When the documents aren’t there, the standard approach is to begin with a field audit - photograph nameplates and breaker compartments, then record relay settings exactly as found.
For transformer data, IEEE 1584 recommends using nameplate impedance wherever it’s available. Only use standardized impedance tables when the nameplate is unreadable or missing. For protective devices, if relay settings can’t be confirmed, engineers should use the next upstream device to set clearing time. That is a conservative approach and may lead to a higher incident energy estimate.
Use Electrical Trader to verify breaker, transformer, and MV switchgear ratings when replacement data is missing. Any estimated value should be clearly flagged in the study documentation.
sbb-itb-501186b
Step 2: Review Fault Current, Arcing Current, and Clearing Time
Once the system data is confirmed, the next job is to calculate bolted fault current, arcing current, and clearing time. These numbers decide two things: whether the equipment can be worked on safely and what the arc-flash label needs to show.
Convert Bolted Fault Current to Arcing Current
The study begins with the three-phase bolted fault current at the MV bus. IEEE 1584-2018 then converts that bolted fault current into arcing current based on voltage, enclosure type, electrode setup, gap, and grounding data.
Arcing current is often lower than bolted fault current. That difference matters a lot because protective devices respond to arcing current, not bolted fault current. If an engineer checks device behavior only at the maximum fault current, it’s easy to assume the device will trip in its instantaneous region. But the relay may actually see the lower arcing current and operate in a slower part of the curve instead.
Why Clearing Time Often Drives Incident Energy
Next, plot the arcing current on the upstream device’s time-current curve to find the clearing time. That includes both relay operating time and breaker opening time. This total clearing time is the value used in the incident energy calculation.
Here’s the part that trips people up: lower fault current does not always mean lower hazard. If a system change or high transformer impedance cuts available fault current, arcing current drops too. And that can push the relay out of its instantaneous region and into a time-delay region. A trip that might have cleared in 0.08 seconds can stretch to 0.5 seconds or more. So even with less current, incident energy can go up when clearing time gets longer. Reducing clearing time from 0.5 seconds to 0.1 seconds can cut incident energy by about a factor of 5.
Selective coordination often adds delay on the upstream device, which pushes incident energy higher. Many existing MV installations were set up so upstream devices are intentionally delayed. That can leave MV buses exposed to clearing times of 0.4 seconds or longer and increase the arc-flash boundary. NFPA 70E tables for MV metal-enclosed switchgear (1–15 kV) show that even with a maximum clearing time of 0.24 seconds (15 cycles) and a 36-inch working distance, the result is still PPE Category 4 with a 40-foot arc-flash boundary.
Ways to Reduce Incident Energy When Results Are Too High
If incident energy comes out too high, start by reducing clearing time.
- Lower instantaneous pickup and reduce time delay where coordination allows: Check coordination before making any pickup change.
- Enable maintenance setting: Modern microprocessor-based relays can use alternate setting groups that temporarily shorten time delays during energized work. Use that group for the task, then return to normal settings afterward.
- Add arc-flash detection relays: Optical sensors with overcurrent verification can detect an arc and send a trip signal in 1–2 ms. That can cut clearing time to 30–50 ms and reduce incident energy fast.
- Apply zone-selective interlocking (ZSI) or bus differential protection: These schemes let the closest device trip for internal faults without waiting on coordination timers, which shortens bus clearing time.
- Reconfigure system topology: Opening tie breakers to split large MV buses lowers available fault current at each lineup. But check clearing time again, because lower current can move protection into a slower operating region.
After any setting change, verify it against short-circuit ratings, update protection records, and brief operations before work starts again. Those changes also need to appear on the label before the next task. The new incident energy and working distance then carry into the PPE and labeling decisions in Step 3.
Step 3: Set Working Distance, Calculate Incident Energy, and Prepare Labels
Working Distance and Incident Energy at the Task Location
After you have clearing time, the next step is to apply that result at the worker’s actual task distance. Working distance means the distance from the arc source, usually the bus, to the worker’s face and chest during the task.
For MV switchgear, many studies use a reference working distance of 36 in.. But that number should match the job in front of the worker. Normal switching may keep someone farther back. Racking a breaker in or out, opening a compartment door, or doing an infrared inspection can bring the body much closer to the source.
That matters because incident energy drops as working distance increases and goes up as the worker moves closer. A shorter working distance can push the task into a higher PPE range. So the study needs to use the distance that fits the real work position, not just the equipment class.
How to Use Results for PPE Selection and Task Planning
Use the calculated incident energy at that exact distance to set PPE and task controls. Start with the task, confirm the incident energy in cal/cm² for that compartment, and then choose arc-rated PPE with a rating above the calculated incident energy.
That same value should also appear in the energized work permit, along with the arc flash boundary and any required controls.
At 40 cal/cm² and above, PPE by itself is not enough. At that point, the safer move is to add distance or put something between the worker and the hazard. In practice, that can mean:
- Remote racking or remote switching devices
- Physical barriers or shutters
- Moving that lineup up the list for equipment replacement
A lot of facilities use the arc flash assessment as a way to rank high-risk locations and steer capital spending toward the worst ones first. That’s often where the study stops being just paperwork and starts shaping day-to-day decisions.
Arc Flash Label Content and Field Use
Once PPE is set, turn the study into a label that people in the field can use at a glance. A complete MV switchgear arc flash label for a U.S. facility should include the equipment ID, nominal voltage, arc flash boundary, incident energy in cal/cm² at the stated working distance, minimum arc rating required, and the analysis date in MM/DD/YYYY format.
Labels should be printed on durable, UV-resistant material and mounted on the front of each compartment near the operating handle or viewing window.
For MV switchgear, incident-energy-based labels give clearer field guidance because workers can see the exact exposure level tied to the stated working distance. Here’s how the two common label types compare:
| Label Type | Field-Team Clarity | Update Effort After System Changes | Consistency After System Changes |
|---|---|---|---|
| Incident-energy-based | High - workers see the exact cal/cm² value and required PPE for the stated working distance | Higher - recalculation is needed when fault current, clearing time, or settings change | High - numeric values directly reflect the current study |
| PPE-category-based | Moderate - simpler to read, but no underlying energy value is shown | Lower - categories may remain unchanged through minor adjustments | Potentially lower - categories can mask real changes in hazard level |
For buyers, Electrical Trader purchase records can support the study. But the labels must match the installed configuration, not catalog data.
Conclusion: A Repeatable Process for Safer MV Switchgear Decisions
Arc flash risk assessment for MV switchgear is not a one-time calculation. It’s a repeatable control process, not a report you file away and forget. Any system change can affect the result, whether that’s a new transformer, revised relay settings, or a different utility contribution.
Start with accurate system data. Then verify fault current and arcing current, confirm clearing time, use the actual working distance, and label the gear based on those inputs. Clearing time often has more effect on incident energy than fault current alone, which is why relay timing and breaker clearing time need to be checked at the actual settings.
That study data does more than support labels. It helps with maintenance planning, upgrade choices, and safer switching in the field. For buyers and field teams, keeping arc flash data current is what makes it useful. It helps them do more than meet a rule on paper. It helps them sort equipment upgrades and make better switching calls.
Teams sourcing replacement breakers, transformers, or MV switchgear parts can use Electrical Trader to find equipment, but the engineering data and protection settings are still what shape the safety result.
The goal is safer switching, not just a compliant label. When the data stays current, the label stays useful and the risk stays visible.
FAQs
Why can lower fault current create higher arc flash risk?
Lower fault current can lead to more arc flash risk if it slows down protective device tripping. Here’s the catch: higher fault current will often make breakers or relays trip almost at once, while lower current may take longer to hit that trip point.
And that delay matters.
Incident energy depends on both fault current and clearing time. So even if the current is lower, the arc can last longer. That extra time lets more thermal energy build up and increases a worker’s exposure.
How often should an MV switchgear arc flash study be updated?
An arc flash study for medium-voltage switchgear should be updated at least every five years to stay compliant with NFPA 70E.
It should also be updated right away after major system changes, like replacing transformers, upgrading utility service, or changing protective device settings. On top of that, annual audits are a smart way to keep safety protocols accurate and effective.
What changes require a new arc flash label?
A new arc flash label is required any time major electrical system changes affect incident energy calculations or other assessment details.
That can happen after equipment replacements, feeder changes, shifts in fault current, updates to protective device settings, or when equipment is moved or installed secondhand.
Labels also need to be reviewed and updated at least every five years to stay compliant with NFPA 70E and the NEC.