Ultimate Guide to Energy Data Analytics
Energy data analytics transforms raw information from smart meters, IoT devices, and grid sensors into actionable insights. These insights help reduce energy costs, improve grid performance, and extend equipment lifespan. Here's a quick overview of what you need to know:
- Data Sources: Smart meters, grid sensors, and Distributed Energy Resources (DER) provide vast amounts of real-time and historical data for analysis.
- Techniques: AI and machine learning predict energy demand, detect anomalies, and optimize maintenance strategies.
- Big Data Architecture: Systems like HDFS, NoSQL databases, and tools like Apache Kafka manage and process the massive data generated by modern grids.
- Applications: Analytics enable demand-side management, renewable energy integration, and equipment optimization.
- Challenges: Managing data volume, ensuring security, and meeting regulatory compliance are key hurdles.
Energy companies are leveraging AI and decentralized systems to make grids smarter and more efficient. From predicting renewable energy output to preventing outages, data analytics is shaping the future of energy management.
Energy Data Analytics
sbb-itb-501186b
Data Sources and Types in Energy Analytics
Energy analytics relies on a wide range of data streams to track household electricity usage and monitor grid conditions. At the heart of this system are smart meters, which record and transmit electricity usage every 15 to 60 minutes instead of once a month. This shift has dramatically increased data volume - by about 3,000 times compared to traditional metering methods. By 2022, the electric utility industry was handling over 2 petabytes of data annually from smart meters alone, with more than 1.1 billion meters installed globally.
In addition to metering, grid sensors and Distributed Energy Resources (DER) data play a key role. Grid sensors provide real-time monitoring of voltage and current across substations and distribution lines, which is especially important as utilities incorporate more customer-owned solar panels and batteries. DER data has become increasingly critical - Vermont, for example, anticipates that within the next decade, these resources will meet its entire daytime minimum load.
Load profiles and generation forecasts integrate consumption trends with weather data to predict energy demand and renewable energy output. Factors like wind speed, solar irradiance, and historical usage patterns feed algorithms that help balance supply and demand. In July 2024, Vermont Electric Power Company (VELCO) collaborated with Pacific Northwest National Laboratory on the MAPLE LEAF project. This initiative used aggregated smart meter data and integrated DER and grid-edge sensor information into a cloud-based platform, preparing the grid for a renewable-powered future.
Smart Meters and Utility Data
Smart meters provide detailed consumption data, recording between 2,880 and 35,040 data points per customer each year. This granular data helps utilities monitor load patterns, detect anomalies, and respond to sudden demand changes in real time. The adoption of Advanced Metering Infrastructure (AMI) has grown rapidly, with U.S. installations increasing 17-fold between 2007 and 2012.
This data supports a range of applications, from improving billing accuracy to enabling demand response programs that adjust consumption during peak periods. For grid managers, AMI data offers the insights needed to optimize transformer loading and reduce energy waste across distribution networks.
Synchrophasor Measurements
Synchrophasors and sensors provide real-time data on voltage and current, offering a precise snapshot of the grid's status at any moment. These measurements are essential for wide-area monitoring systems that identify disturbances before they escalate into outages. Utilities use this data to optimize volt-VAR curves, which help maintain power quality and system flexibility as renewable energy sources are added to the grid.
With much of the transmission infrastructure in the U.S. and Europe aging - many components are over 25 to 40 years old - sensor-based monitoring has become indispensable. Synchrophasor data allows operators to detect voltage sags, frequency deviations, and other signs of potential equipment failures or instability, helping to ensure grid reliability.
Load and Generation Data
Load profiles combine historical and real-time consumption data to forecast energy demand across various timeframes. Utilities analyze seasonal trends, peak usage periods, and customer behavior to estimate the power needed at any given time. Weather stations contribute by providing data on wind speed and solar irradiance, which is crucial for forecasting renewable energy generation.
"CIM is an industry standard that serves as the 'Rosetta Stone' of sorts for the electric grid. All grid models, meter data, substation data, and grid-edge sensor data are being converted to CIM." - U.S. Department of Energy
The Common Information Model (CIM) acts as a universal language, enabling different systems - like meters, substations, and IoT devices - to share data seamlessly. For power distribution professionals, integrating load and generation data through CIM-compatible platforms ensures smooth communication across systems. This compatibility is essential for managing the grid edge, where DER and customer-owned resources interact with the broader network. These integrated datasets are key to advancing analytics that improve grid stability.
Big Data Architecture for Energy Systems
Energy systems rely on a four-stage big data process - acquisition, management, processing, and analytics - to convert sensor signals into meaningful insights. These stages are essential for maintaining grid stability. This structure serves as the foundation for real-time energy management and facilitates the advanced analytics discussed later.
Take Iberdrola, for instance. Their 11 million smart meters generate 240 million data entries daily. Additionally, sampling 1 million smart meters every 15 minutes results in nearly 2,920 TB of data annually. Managing such volumes requires robust distributed systems.
"The triumph of the smart grid energy paradigm depends on the factor of big data analytics. This includes the effective acquisition, transmission, processing, visualization, interpretation, and utilization of big data." - Dabeeruddin Syed et al., IEEE Access
This architecture combines batch processing for historical trend analysis with stream and in-memory processing for near-instant fault detection. Let’s explore the storage and processing frameworks that make this possible.
Data Storage and Processing Frameworks
Distributed File Systems (DFS), such as HDFS, are the backbone of scalable energy data storage. These systems distribute data across server clusters, ensuring fault tolerance and availability even when hardware fails. To handle the diverse nature of grid data - structured meter readings, semi-structured XML logs, and unstructured weather data - utilities rely on NoSQL databases like HBase or Cassandra. For ad-hoc querying, NewSQL interfaces are often paired with these systems.
Efficiency hinges on the data locality principle: instead of moving massive datasets to algorithms, computational tasks are performed near the data. This minimizes network strain and reduces latency, which is critical for processing terabytes of data daily. Tools like InfluxDB and TimescaleDB are tailored for high-volume time-series data, while column-oriented stores like HBase excel in compressing data for batch tasks.
Apache Kafka plays a key role in real-time data ingestion, streaming SCADA, market, and metering data seamlessly. Early data quality checks - such as validating ranges and ensuring timestamp accuracy - save significant costs compared to fixing issues later during visualization or decision-making. Additionally, feature stores that house pre-computed metrics like rolling averages or weather adjustments eliminate the need for repetitive calculations in machine learning workflows.
Integration with Monitoring and Control Systems
Data storage and processing alone aren't enough; integration with operational systems ensures insights translate into action. Big data platforms connect directly with Supervisory Control and Data Acquisition (SCADA) systems and Advanced Metering Infrastructure (AMI), providing grid operators with a unified perspective. This integration enables a shift from reactive maintenance - addressing issues after they arise - to proactive measures that prevent failures. By combining batch and stream processing, the architecture supports both real-time decisions and long-term trend analysis.
The communication network spans Home (HAN), Neighborhood (NAN), and Wide Area Networks (WAN), employing technologies like PLC, ZigBee, and cellular systems. Tracking data lineage is crucial for regulatory compliance and for validating decisions made in grid control. A well-organized data catalog - documenting datasets, their quality, and update schedules - ensures analysts can focus on deriving insights rather than searching for data. This structured approach to data management is vital as Distributed Energy Resources introduce increasingly complex two-way power flows within distribution networks.
Analytics Techniques for Energy Data
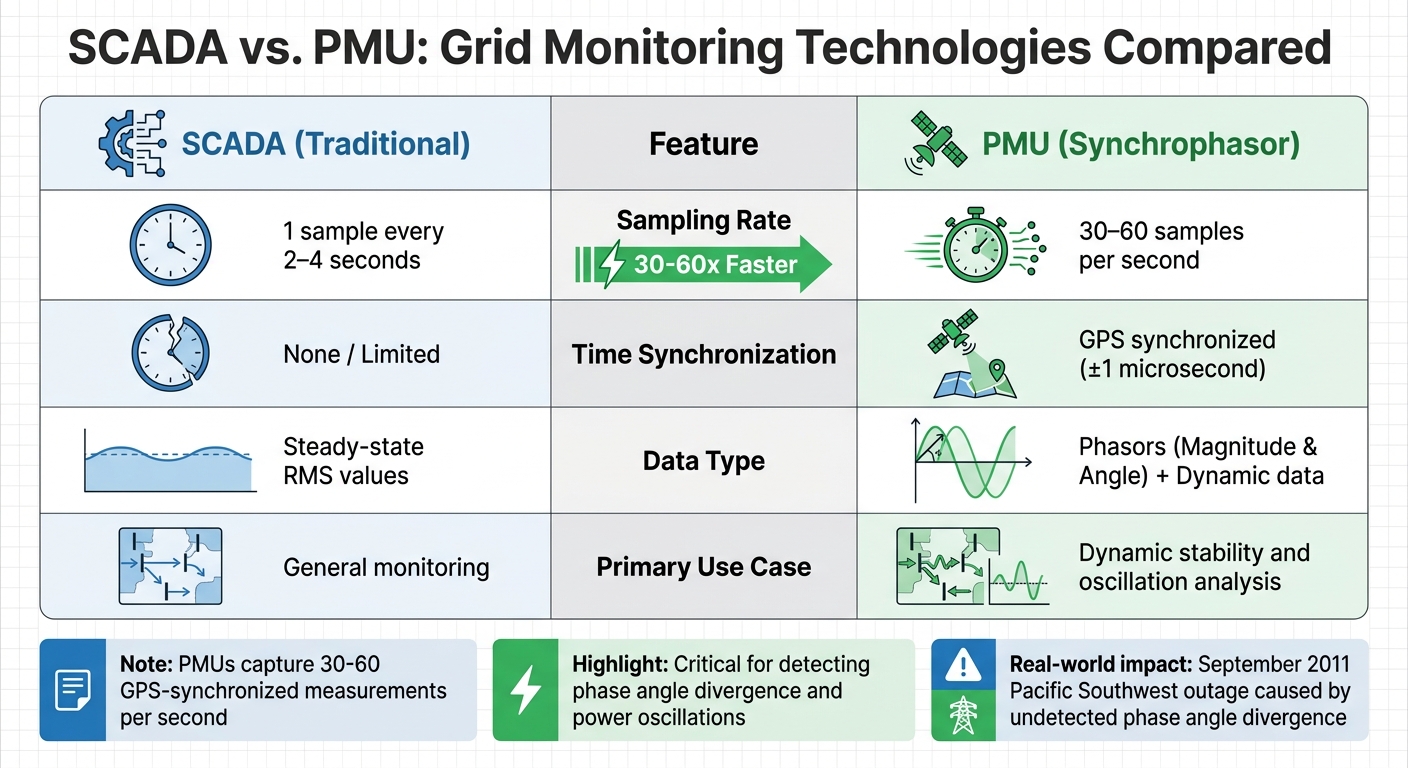
SCADA vs PMU Synchrophasor Technology Comparison for Grid Monitoring
AI-powered analytics are transforming the energy sector by predicting demand and optimizing maintenance strategies. Load forecasting employs tools like Artificial Neural Networks (ANN), Support Vector Machines (SVM), and XGBoost to predict energy needs over short-, medium-, and long-term periods. This helps streamline energy dispatch and cut operating costs.
For example, in January 2025, the Fraunhofer Institute in Germany introduced an AI-based forecasting tool that used historical weather and consumption data. The results? A 15% reduction in energy waste and a 10% improvement in grid reliability, thanks to real-time energy dispatch adjustments. Similarly, Pacific Gas and Electric (PG&E) in the U.S. enhanced its Advanced Metering Infrastructure with AI analytics, achieving a 12% drop in peak demand and a 20% improvement in outage response times by leveraging real-time voltage regulation and fault detection.
AI also plays a key role in anomaly detection, pinpointing unusual consumption patterns that could signal equipment malfunctions or security breaches. In January 2025, National Grid in the U.K. used predictive analytics to monitor aging infrastructure through real-time sensor data. This reduced maintenance expenses by 25% and extended the lifespan of critical assets. Additionally, machine learning supports demand response programs, enabling users to adjust their energy usage based on real-time pricing. This helps ease peak loads and stabilize the grid.
"AI can enable a comprehensive framework for effective power system control, management, energy market pricing, and policy recommendations."
– International Journal of Precision Engineering and Manufacturing-Green Technology
While these predictive tools enhance long-term energy planning, synchrophasor analysis offers immediate insights for maintaining grid stability.
Synchrophasor Data Analysis for Grid Stability
Traditional SCADA systems sample data every 2–4 seconds, but Phasor Measurement Units (PMUs) take this to another level, capturing 30–60 GPS-synchronized measurements per second. This high-frequency data provides a dynamic, real-time view of the grid, complementing data from smart meters and grid sensors. The rapid sampling is crucial for identifying issues like phase angle divergence and power oscillations that slower systems might overlook. For instance, in September 2011, a phase angle divergence that went undetected caused an 11-minute outage in the Pacific Southwest.
| Feature | SCADA (Traditional) | PMU (Synchrophasor) |
|---|---|---|
| Sampling Rate | 1 sample every 2–4 seconds | 30–60 samples per second |
| Time Synchronization | None / Limited | GPS synchronized (±1 microsecond) |
| Data Type | Steady-state RMS values | Phasors (Magnitude & Angle) + Dynamic data |
| Primary Use Case | General monitoring | Dynamic stability and oscillation analysis |
Synchrophasor analytics are essential for monitoring voltage stability, tracking the Rate of Change of Frequency (ROCOF), and detecting grid oscillations between 0.1–3 Hz, which indicate stress. These tools are especially valuable in distribution networks, helping operators detect issues like broken wires or islanding before they escalate. As renewable energy sources introduce faster dynamics and lower system inertia, synchrophasors provide the detailed visibility needed to manage these fluctuations and fine-tune inverter controls.
"Synchrophasors and WAMS are no longer emerging technologies - they are essential tools for modern grid operation."
– Keentel Engineering
Applications of Energy Data Analytics in Power Distribution
Using the robust data frameworks discussed earlier, energy analytics delivers real-world benefits in power distribution. Real-time insights reshape how utilities handle demand, integrate renewables, and maintain equipment, driving efficiency and reliability.
Demand-Side Management
Advanced Metering Infrastructure (AMI) gives utilities a detailed view of energy usage, enabling them to identify inefficiencies and implement demand response programs. These programs encourage customers to shift energy usage away from peak times, easing strain on the grid. Machine learning models take it further by analyzing historical consumption data alongside weather forecasts to predict future energy needs, ensuring resources are allocated efficiently and overproduction is avoided.
For businesses, understanding peak usage trends through analytics can lead to significant cost savings. By adjusting operations to off-peak hours, they can lower utility bills. Smart grid analytics also make dynamic load balancing possible, redistributing energy across regions to keep the grid stable. With over 1.1 billion smart meters installed globally by 2022, utilities now have the tools to convert raw data into actionable strategies, reducing waste and cutting costs. These advancements not only improve demand management but also support renewable energy integration and better asset use.
"Smart grid analytics software is one of the most important investments the modern utility can make."
– Brian E. Hoff, Vice President of Product Management, Grid Software, GE Vernova
Renewable Energy Integration
The variability of solar and wind energy presents challenges for traditional grids, but energy data analytics helps bridge the gap. Real-time tools enable grid operators to balance the intermittent supply of renewables with fluctuating demand. Predictive modeling, informed by weather data, forecasts generation patterns, helping utilities manage renewable energy's unpredictability.
As renewable energy becomes increasingly data-driven, utilities are consolidating their data systems to address the challenge of fragmented information across devices and platforms. AI and machine learning are automating these processes, going beyond historical data to deliver predictive insights. This ensures grid stability and resilience as renewable capacity grows.
"The integration of renewable energy sources and the development of smart grids will play a significant role in the future of energy data analytics. These advancements will enable more sustainable and resilient energy systems, supporting global efforts to combat climate change."
– MeterLogix Team
Equipment Optimization and Maintenance
Energy analytics also plays a critical role in maintaining and upgrading grid infrastructure. By identifying patterns that indicate potential malfunctions, utilities can shift from reactive repairs to proactive maintenance. This approach minimizes wear and tear, extends the lifespan of key equipment like transformers and breakers, and reduces maintenance costs.
Analytics also guide timely upgrades. By monitoring performance trends, utilities can decide when to replace outdated equipment with more efficient alternatives. For sourcing replacement parts or upgrading systems, platforms such as Electrical Trader provide access to new and used power distribution equipment. Centralized data systems and well-calibrated metering devices ensure the accuracy of these analytics, making them a reliable tool for decision-making.
"By analyzing energy data, businesses can optimize their processes and equipment usage, leading to more efficient operations. This not only reduces energy consumption but also extends the lifespan of equipment, reducing maintenance costs."
– MeterLogix Team
Challenges and Best Practices in Energy Data Analytics
Energy data analytics offers immense potential for improving efficiency, but it also comes with its share of hurdles. From managing enormous data streams to meeting stringent regulations, utilities and energy companies face an array of challenges that require careful handling.
Managing Data Volume and Real-Time Processing
The sheer amount of data generated by Advanced Metering Infrastructure (AMI) and IoT devices can overwhelm traditional systems. Smart meters alone produce vast streams of information that need to be processed instantly to identify trends, peaks, or anomalies. However, uncalibrated devices can lead to incomplete or inaccurate readings, which can undermine the accuracy of analytics. Regular calibration is essential to ensure data reliability and maintain processing speed.
Another significant issue is system integration. Devices and legacy equipment often rely on different communication protocols, making it difficult to consolidate data effectively. Implementing a centralized data management system can address this fragmentation by integrating data from various sources. Real-time dashboards further enhance this setup by providing transparency and enabling quick, informed decisions.
These integration issues often intersect with the growing need for robust security and regulatory compliance.
Data Security and Compliance
As energy systems become increasingly digitized, the risk of cyberattacks has grown. In fact, ransomware attacks on Industrial Control Systems surged by 87% in 2024, while third-party breaches accounted for 45% of all energy sector security incidents - well above the global average of 29%. The financial impact is substantial, with the average cost of a data breach in the energy sector reaching $4.78 million in 2023.
A unified data platform that combines IT, cloud, and OT security telemetry can help eliminate vulnerabilities caused by siloed systems. Role-Based Access Control (RBAC) adds another layer of protection by ensuring that users only access data relevant to their roles, safeguarding sensitive infrastructure information. Automated tools for compliance reporting can cut manual effort by up to 90%, making it easier to meet standards like NERC CIP, FERC, and TSA Pipeline Security Directives. Additionally, adopting a tiered storage strategy - keeping hot data for 30–90 days, warm data for 1–2 years, and cold data for 7–10 years - balances performance with cost-effective compliance.
While security and compliance are critical, managing operational costs without sacrificing performance is equally important.
Balancing Costs and Performance
Achieving cost-efficiency while maintaining high-performance analytics requires thoughtful strategies. For instance, modern data lakehouse platforms can reduce long-term log storage and regulatory audit costs by as much as 70%. Effective data management also helps identify overpowered equipment, enabling targeted upgrades or adjustments to optimize performance.
Integrating Energy Data Management systems with Computerized Maintenance Management Systems (CMMS) can further drive efficiency. By monitoring equipment performance and scheduling maintenance before issues arise, companies can extend the lifespan of their assets and reduce maintenance costs. However, resistance from employees accustomed to traditional workflows can slow the adoption of data-driven practices. Providing comprehensive training and showcasing measurable benefits can help overcome this internal resistance.
Future Trends in Energy Data Analytics
The energy sector is undergoing rapid transformation as emerging technologies redefine how data is collected, processed, and leveraged for decision-making. Two major trends are driving these changes: the integration of artificial intelligence (AI) into real-time operations and the shift of intelligence from centralized systems to the grid's edge. Together, these advancements are expanding the predictive and monitoring capabilities of utilities, enabling smarter grid management.
AI-Driven Analytics and Automation
AI is no longer limited to forecasting; it’s now playing a pivotal role in active grid management. For example, advanced models like Long Short-Term Memory (LSTM) networks can predict energy demand 24–72 hours ahead with an impressive accuracy of 96–98%. Similarly, Convolutional Neural Networks (CNNs) can forecast solar shading events just 5–15 minutes before they occur. This level of precision allows utilities to adapt operations in real time, improving efficiency and reliability.
One of the standout benefits of AI is its ability to operate at the edge, significantly reducing latency. While traditional cloud computing introduces delays of 200–500 milliseconds - too slow for some critical grid functions - edge AI achieves response times under 10 milliseconds by processing data directly on devices. This approach not only speeds up decision-making but also slashes bandwidth costs by over 90%, as only critical insights are transmitted instead of raw data streams.
Real-world examples highlight the potential of AI-driven systems. For instance, Google used DeepMind’s reinforcement learning to cut data center cooling energy by 40%. Similarly, automotive manufacturers have saved millions annually by linking paint shop ovens to AI-optimized production schedules.
Despite these advancements, trust in AI remains a hurdle. Many facility managers are wary of AI systems, often perceiving them as opaque "black boxes." To address this, Explainable AI (XAI) has become crucial, offering transparency by clarifying the reasoning behind AI decisions. Notably, most industrial AI energy projects achieve full returns on investment within 18 months, while also cutting energy consumption by 10–25%.
Beyond centralized AI, a significant shift is happening as intelligence moves closer to the grid, laying the groundwork for decentralized data systems.
Decentralized Data Systems
Decentralized systems are transforming grid intelligence by embedding it directly into devices like meters, transformers, and sensors. This shift moves away from reliance on centralized cloud environments, enabling real-time insights and actions at the edge. Southern Company exemplifies this approach, managing a decentralized network of over 4.6 million smart meters across its subsidiaries: Alabama Power (1.6 million), Georgia Power (2.8 million), and Mississippi Power (200,000). This infrastructure, operational for more than a decade, provides a rich historical dataset for training predictive AI models.
"Edge intelligence and centralized analytics are two sides of the same coin: insight closer to the event, action closer to the customer."
- Joyce Solomon, Manager, Data Analytics, Southern Company
Next-generation smart meters are taking this a step further. These devices actively detect anomalies, such as voltage fluctuations or load imbalances, without needing cloud-based processing. They can even perform load disaggregation, identifying specific appliance usage - like HVAC systems or EV chargers - without requiring additional hardware. Such capabilities are vital for delivering the real-time insights that modern grid systems demand.
Decentralized systems bring tangible benefits to grid management. They enable faster outage detection and restoration, reduce delays, and support dynamic demand response by allowing meters to communicate load flexibility directly to operators. As Brandon Lundy, Director of AMI/MDM Systems at Southern Company, explains:
"At Southern Company, AMI data is the foundation of almost every major analytics initiative we undertake."
For utilities adopting decentralized systems, maintaining accurate relationships between customers, meters, transformers, and feeders is essential for reliability and planning. Additionally, analyzing smart meter data to identify EV charging patterns can guide grid upgrades and the development of new utility rates, ensuring infrastructure evolves alongside shifting consumption trends.
Conclusion
Energy data analytics is reshaping the way utilities and energy experts handle power distribution. It’s no longer about reacting to problems but about using data to make smarter, forward-thinking decisions. This shift is key to keeping grids stable, integrating renewable energy, and meeting increasing demand efficiently.
The backbone of successful analytics lies in accurate data collection and dependable infrastructure. Tools like Advanced Metering Infrastructure (AMI), smart sensors, and IoT devices deliver real-time insights that help pinpoint inefficiencies and act on them quickly. But these tools are only as good as the data they provide. As Bernard Marr highlights, "The higher the veracity of the data equates to the data’s importance to analyze and contribute to meaningful results for an organization". This means well-calibrated meters and high-quality sensors are non-negotiable for any analytics effort.
Bringing together data from various sources - like smart grids, weather systems, and market trends - creates a clear picture of the grid’s current and future needs. Pair this with predictive analytics and machine learning, and utilities can forecast demand more accurately, avoid equipment failures, and manage the challenges of renewable energy alongside traditional power generation.
For organizations aiming to build or improve their analytics systems, the right mix of software and hardware is crucial. Platforms such as Electrical Trader offer essential components like breakers, transformers, and smart meters, which form the physical foundation of modern energy infrastructure. Reliable equipment not only boosts data accuracy but also extends the lifespan of assets and trims down maintenance costs - key considerations for any infrastructure investment.
The energy sector is evolving rapidly, with AI and decentralized systems driving the next wave of advancements. Those who adopt data analytics today are setting themselves up to lead the charge in creating smarter, more resilient power grids.
FAQs
What energy data should we collect first?
To get a clear picture of your energy use, begin by collecting baseline data on current consumption. Use tools like smart meters or IoT devices to monitor energy usage in real time throughout your facility. These devices can help pinpoint areas of inefficiency and identify zones with higher energy consumption.
Tracking historical energy data regularly is also key. It allows you to spot patterns and trends over time, which can guide smarter decisions about energy management. Having accurate baseline data isn't just helpful - it’s a must for improving efficiency, reducing costs, and aligning with your sustainability goals.
How do utilities handle real-time grid data at scale?
Utilities handle real-time grid data on a massive scale by leveraging smart meters and sensor networks. These devices constantly gather and send information about energy usage, grid performance, and overall conditions. Advanced analytics platforms then process this stream of data to track demand, identify faults, and fine-tune grid operations. This approach helps utilities manage energy flow more efficiently, respond to outages faster, and maintain load balance - critical tasks as grids incorporate more renewable energy sources and meet growing energy demands.
How can AI cut outages and maintenance costs?
AI plays a key role in cutting down outages and maintenance expenses through predictive maintenance. By analyzing sensor data - like vibration patterns in transformers - it can predict equipment failures before they happen. This allows utilities to plan repairs in advance, reducing emergency fixes by as much as 60% and saving millions of dollars each year. On top of that, real-time analytics enhance energy distribution, leading to fewer outages and more efficient operations, all thanks to smarter, data-driven decision-making.