

How Core Design Drives Transformer Energy Savings
A transformer can burn through 2,600+ kWh a year at idle from just 300 W of no-load loss. If it stays energized 24/7, core design has a direct effect on your power bill long before the unit carries much load.
If I were screening transformers, I’d focus on four things first:
- Core steel: amorphous metal usually cuts no-load loss far below CRGO
- Core joints and laminations: step-lap joints and thinner laminations help trim core loss
- Flux density: lower tesla usually means lower no-load loss, less noise, and a larger core
- Build quality and test data: factory no-load loss and no-load current numbers matter more than raw steel claims
The article’s main point is simple: don’t buy on price or “low-loss” labels alone. I’d compare unit ratings first, then check no-load loss (W or kW), no-load current (%), core material, test conditions, and a unit-specific factory test report. Even a gap like 1.4 kW vs. 0.8 kW in no-load loss can mean about $631 per year at $0.12/kWh in a 24/7 U.S. facility.
A few numbers stand out:
- Amorphous cores can cut no-load loss by about 60–75% versus standard CRGO designs
- Thicker laminations can push eddy current loss to about 2.3x higher under the same test setup
- A poorly built core can show a building factor above 2.0
- Over a 20-year life, lower no-load loss can add up to thousands of dollars per transformer
Lesson 4.3: Magnetic Cores and Materials: Where Transformer Efficiency Begins
sbb-itb-501186b
Quick Comparison
| What to compare | Lower-loss signal | What to watch for |
|---|---|---|
| Core material | Amorphous metal or higher-grade GO steel | Missing material grade |
| Joints | Step-lap or mitered joints | Butt-lap or no joint details |
| Laminations | Thinner laminations, such as 0.23–0.27 mm | Thicker gauges with no loss detail |
| Flux density | Lower design flux density at rated voltage | High tesla with no explanation |
| Test proof | Factory report with measured no-load loss and no-load current | Only raw steel W/kg or sales copy |
So if I wanted a short rule: match kVA, voltage, phase, and 60 Hz first - then compare measured no-load watts and annual idle cost. That gives you a much better read on what the transformer will cost to own.
Core material and shape set the baseline for no-load loss
Transformer Core Materials Compared: No-Load Loss, Cost & Efficiency
Core material and assembly set the baseline for no-load loss. If you're comparing transformers, check these details before you look at price or big nameplate claims. Start with the steel grade. Then look at whether the joints and lamination thickness keep that edge in the finished core.
How core steel grade affects specific loss
Core steel is often compared by specific loss. That’s the watts of heat the material gives off per kilogram at a given flux density and frequency. Lower W/kg means lower loss under the same test condition.
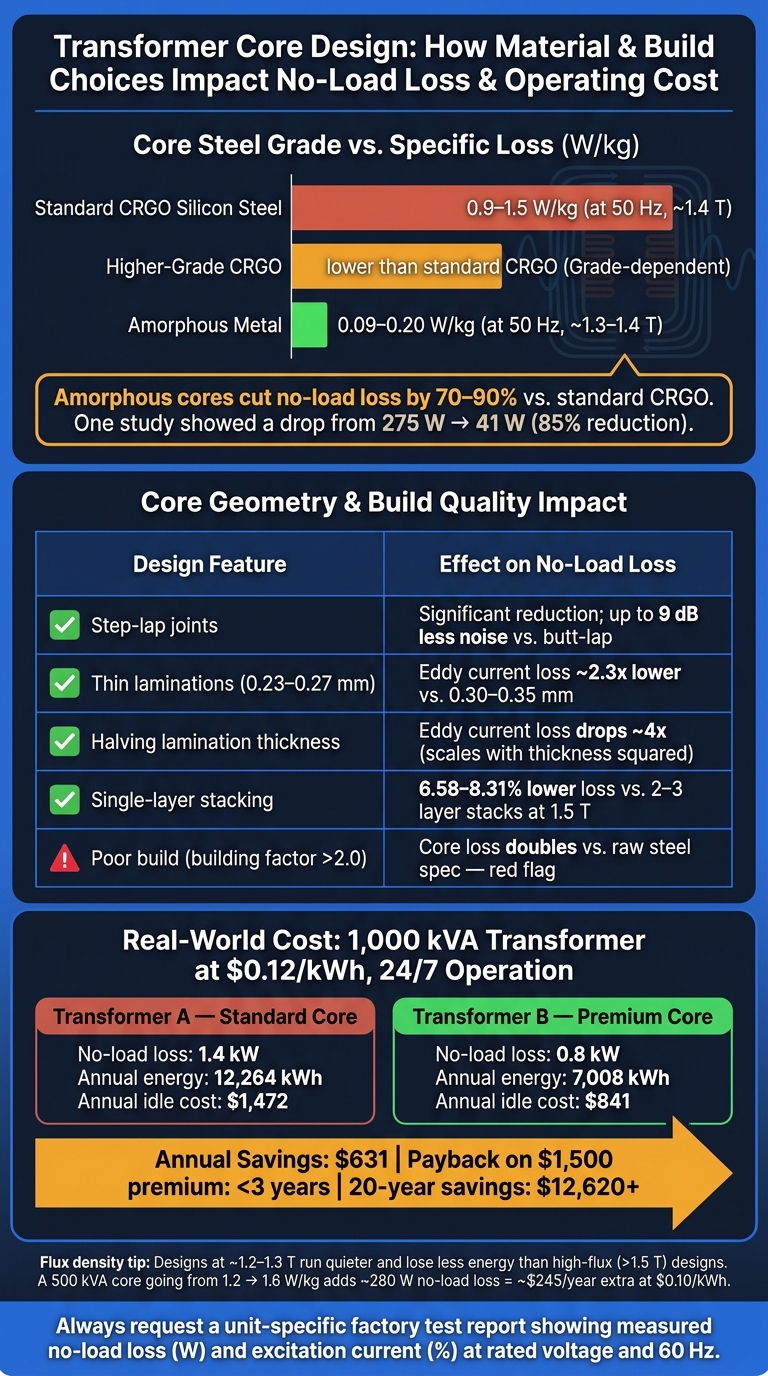
CRGO silicon steel usually falls between 0.9 and 1.5 W/kg at 50 Hz and around 1.4 T. Higher-grade CRGO tends to post lower specific loss than standard CRGO. Amorphous metal cores are in a very different range: their specific loss usually lands between 0.09 and 0.20 W/kg at 50 Hz and around 1.3–1.4 T - about 70–90% lower than conventional CRGO.
That difference can snowball fast in actual equipment. One study found a distribution transformer's no-load loss fell from 275 W to 41 W - an 85% reduction - after switching from a CRGO core to an amorphous metal core. Manufacturers also report 60–70% reductions in no-load loss with amorphous cores versus standard grain-oriented steel.
| Core Material | Typical Specific Loss |
|---|---|
| Standard CRGO silicon steel | 0.9–1.5 W/kg at 50 Hz and around 1.4 T |
| Higher-grade CRGO | Lower than standard CRGO; compare at the same test conditions |
| Amorphous metal | 0.09–0.20 W/kg at 50 Hz and around 1.3–1.4 T |
When you read a data sheet, don't stop at the W/kg figure. Check the test conditions next to it. A number measured at lower tesla can look better on paper than one tested under a tougher condition. So compare W/kg only when the frequency and flux density match.
How core shape, joints, and laminations affect loss
Even top-tier steel can fall short if the core geometry is poor. The way laminations are cut, stacked, and joined has a direct effect on how smoothly magnetic flux moves through the core - and where loss starts to build.
Step-lap joints are a common choice for cutting no-load loss. Instead of making all the flux cross one interface at the same time, step-lap construction offsets the lamination ends across several layers. Think of it like easing traffic through several lanes instead of forcing every car into one bottleneck. That lowers localized reluctance and cuts magnetizing current. Industry data shows multi-step lap corner joints can reduce sound levels by up to 9 dB compared with butt-lap designs.
Lamination thickness affects a different part of the loss picture. Eddy current loss scales with the square of lamination thickness. So if you cut the thickness in half, eddy current loss can drop by about a factor of four. Premium-efficiency cores use 0.23–0.27 mm laminations, while lower-cost designs use 0.30–0.35 mm. At 50 Hz and 1.7 T, that gap can push eddy current loss to roughly 2.3 times higher in the thicker gauge.
| Design Feature | Effect on No-Load Loss |
|---|---|
| Multi-step lap joints | Significant reduction |
| Mitered joints | Can improve flux continuity vs. butt-lap |
| Thin laminations (0.23–0.27 mm) | Lower eddy current loss |
| Tight stacking and clamping | Prevents interlaminar gaps and flux distortion |
Build quality decides whether the finished core lives up to its loss claim. After that, the next big factor is flux density - because that tells you how hard the core is being driven.
Flux density and build quality determine whether a core performs as specified
A transformer’s no-load loss doesn’t come from the data sheet alone. It comes from two things working together: how hard the core is driven and how well the core is put together. Flux density sets the target. Build quality decides whether the finished unit gets there.
Flux density: the tradeoff between core size and loss
Flux density tells you how much magnetic flux the core carries at rated voltage. In plain English, a smaller, cheaper core usually has to work harder. And when it works harder, no-load loss goes up.
For grain-oriented silicon steel cores at 60 Hz, most designs run between about 1.2 T and 1.6 T. Designs aimed at better efficiency often sit around 1.2–1.3 T, which helps keep no-load loss down. Move up toward 1.5–1.6 T or more, and you can shrink the core and cut first cost, but core loss climbs fast. Audible noise usually climbs too.
The math makes this pretty clear. For a 500 kVA distribution transformer with a 700 kg core, going from a specific loss of 1.2 W/kg to 1.6 W/kg adds about 280 W of no-load loss. At $0.10/kWh, that works out to about $245 per year. So a small material cost cut at purchase can turn into a much bigger energy bill later.
| Flux density level | No-load loss | Core size / first cost | Operating behavior |
|---|---|---|---|
| Low (~1.1–1.3 T) | Lowest | Larger, costlier core | Quieter, lower saturation risk, better efficiency margin |
| Medium (~1.3–1.5 T) | Moderate | Balanced size and cost | Common compromise for utility and commercial use |
| High (>1.5 T) | Highest | Smallest, cheapest core | More noise, greater saturation risk, less energy savings |
When you review a data sheet, ask one simple question: What flux density is the unit designed for at rated voltage and 60 Hz? Setting a maximum, such as ≤1.5 T for CRGO at rated conditions, is a plain, practical way to keep no-load loss under control without ending up with an oversized unit.
Of course, a paper target is only part of the story. If the finished core is built poorly, the design target won’t mean much.
Build quality, test data, and the building factor
The building factor compares assembled-core loss with raw-steel loss under the same test conditions. If assembly is sloppy, that ratio can go above 2.0. That’s a big red flag.
Two shop-floor details matter most here. The first is burr control. Burrs can push finished-core loss up by a lot, with localized losses above 1,000 W/kg at high flux densities when many laminations are affected. The second is stacking practice. Single-layer stacks have shown 6.58–8.31% lower power loss than two- or three-layer stacks at 1.5 T.
That’s why factory test data matters so much. Routine factory acceptance tests usually include no-load loss and exciting-current readings at rated voltage and 60 Hz. Those numbers reflect what the core is actually doing, not what the steel was supposed to do before assembly.
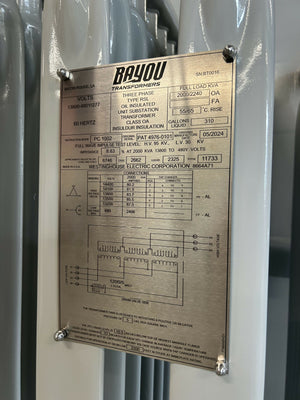
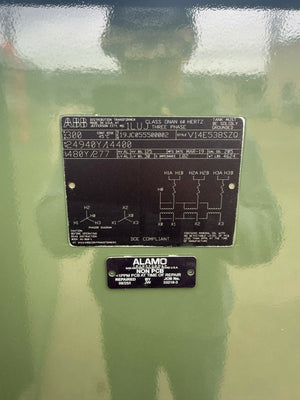
When a factory test report comes in, don’t settle for a pass/fail note. Look for the actual numbers. Routine reports often show no-load loss and no-load current as separate line items. For instance, one ABB transformer report lists no-load loss at 100% rated volts and exciting current directly. Another routine test record shows 333.2 W no-load loss and 0.153% no-load current.
Those are the figures buyers should compare line by line on a data sheet. Not just the raw steel W/kg value. If a supplier gives only raw-steel loss data, treat the claim as incomplete until a factory test report backs it up.
Next, use no-load loss and exciting-current data to compare listings line by line.
How to read data sheets and compare transformer listings
Core-related specs that matter most on a data sheet
Start with the basics. Check that the listing matches on kVA, voltage, phase, and frequency before you compare loss figures. If those specs differ, the no-load loss numbers are not directly comparable.
That point matters more than it may seem. A larger kVA transformer will usually post a higher no-load loss in absolute terms because it often uses more core steel and runs under different flux conditions.
Once those core specs line up, move to the fields tied to loss:
- No-load loss (W or kW)
- No-load current (% of rated current)
- Core material, such as grain-oriented silicon steel, premium GO steel, or amorphous metal
Then look at the build notes. Details like step-lap joints, mitered joints, and lamination thickness help show how the core was made. If a listing skips this information, you can't tell whether the published loss number comes from the actual design or just from thin product copy.
Test conditions matter too. Use the conditions shown on the listing, not guesses. No-load loss is measured at 20 °C. Load loss is measured at 75 °C and 35% of nameplate load. Every listing should state those conditions.
How to convert no-load loss into annual energy cost
After the specs match, convert no-load watts into yearly cost.
Annual no-load cost = No-load loss (kW) × Hours energized/year × Rate ($/kWh)
Here’s a simple example. Say you’re comparing two 1,000 kVA, 12.47 kV–480 V, 60 Hz transformers in a 24/7 facility. Transformer A has 1.4 kW of no-load loss. Transformer B, built with premium grain-oriented steel and step-lap joints, has 0.8 kW.
The savings come from the lower no-load loss. Not from a different nameplate size. Not from sales language.
At a U.S. power rate of $0.12/kWh and 8,760 hours/year:
| Transformer A | Transformer B | |
|---|---|---|
| No-load loss | 1.4 kW | 0.8 kW |
| Annual energy (kWh) | 12,264 | 7,008 |
| Annual no-load cost | $1,472 | $841 |
| Annual savings | - | $631 |
If Transformer B costs $1,500 more up front, that extra cost is paid back in under three years. After that, it saves $631 each year.
When you run this math, state the energized hours and the electricity rate used. Otherwise, the estimate doesn't mean much.
Using Electrical Trader listings to shortlist low-loss transformers
You can use the same approach to sort Electrical Trader listings fast. First, filter for your exact kVA, voltage class, and 60 Hz rating. Then focus on listings that clearly state no-load loss (W or kW), no-load current, and core material.
That gives you something concrete to work with. It also helps you check material, joints, flux density, and overall build quality before you narrow the list.
If a listing leaves out those fields, it's hard to estimate operating cost. Flag it for follow-up before moving ahead with a quote.
A simple comparison template keeps each review consistent:
| Field | Unit 1 | Unit 2 | Unit 3 |
|---|---|---|---|
| kVA | |||
| Core material | |||
| No-load loss (W) | |||
| No-load current (%) | |||
| Test conditions | |||
| Est. annual cost ($) | |||
| Notes |
Estimated annual cost: apply no-load loss (kW) × 8,760 hr/yr × local rate ($/kWh).
One last point: the difference between a standard grain-oriented steel core and an amorphous metal core can reach 55–67% in no-load loss. That gap adds up year after year as long as the transformer stays energized.
If a listing shows only total loss and does not split out no-load loss and load loss, treat it as incomplete.
Conclusion: A checklist for sourcing low-loss transformer cores
Once you’ve compared listings and test reports, use this checklist to confirm what’s behind the numbers.
Lower no-load loss usually comes down to four design choices: core steel, core geometry, flux density, and build quality. High-grade GO steel or amorphous metal, step-lap joints, thin laminations, and conservative flux density tend to produce the lowest losses.
Amorphous metal cores can deliver 60–75% lower no-load loss than conventional CRGO designs of the same rating. And even within CRGO grades, moving to higher-permeability material can cut specific core loss by a clear margin. Over a 20-year service life, that gap can add up to thousands of dollars per unit.
Data sheets and factory test reports are what let you check those claims before you commit. A catalog line that says “low-loss design” but doesn’t list measured no-load watts, test conditions, and core material doesn’t tell you much. Ask for unit-specific routine test reports tied to the serial number, showing no-load loss and excitation current measured at rated voltage and 60 Hz. IEC and IEEE tolerances on guaranteed no-load loss are typically 10–15%, so if you want to know where a given unit lands, you need its actual test data.
Core design requirements to carry into procurement
Use these items to screen quotes fast and weed out incomplete listings.
| Requirement | What to ask for |
|---|---|
| Core material | Steel type (CRGO or amorphous), grade, lamination thickness (e.g., 0.23–0.27 mm) |
| Core geometry and joints | Mitered, step-lap construction or equivalent; request drawings or descriptions |
| Flux density | Design flux density at rated voltage and 60 Hz |
| No-load loss | Guaranteed no-load loss in watts or kilowatts, with test tap and test conditions |
| No-load current | As a percentage of rated current; flags cores running at high flux density |
| Test documentation | Unit-specific factory test report, signed by QA, showing measured no-load loss and excitation current |
| Lifetime cost estimate | Annual no-load energy cost in U.S. dollars at your facility's rate and expected run hours |
Also ask vendors for a 20-year no-load energy cost estimate using your facility’s electric rate.
If a quote can’t answer every line in this table, reject it or send it back for revision.
FAQs
How do I verify a low-loss claim?
Check the transformer nameplate for a DOE efficiency label that shows compliance with U.S. standards in effect since January 1, 2016.
Then review the data sheet and confirm the test results were measured at 60 Hz and 20°C under 10 CFR Part 431.
It also helps to request Material Test Certificates so you can verify:
- core loss values
- permeability curves
When you compare specs, use the same reference points on both sides. For example, compare W/kg at the same flux densities. And when reviewing loss figures, allow a 10% to 15% margin above the guaranteed maximum loss values.
When is an amorphous core worth the extra cost?
An amorphous core is often worth the extra cost when a transformer runs all the time. That’s why it makes sense in utility distribution grids, renewable energy systems, data centers, and smart city infrastructure.
The main reason is simple: it can cut no-load losses by 60% to 80%. So even though the upfront price is usually 16% to 50% higher, that extra spend often pays back in one to four years. After that, the lower energy loss can reduce total ownership cost over the transformer’s life.
What no-load current percentage is considered high?
The available information does not set a specific no-load current percentage that should be treated as high. It talks about no-load losses in watts and overall energy efficiency, but it doesn’t give a standard cutoff for excitation current as a share of rated current.
If your readings look unusually high during testing, a phase-by-phase no-load test is the best next step. That can help isolate possible issues in a specific magnetic circuit or core limb.