How Smart Grids Use Machine Learning for Load Balancing
Machine learning helps smart grids keep power supply and demand in line before problems hit. I’d boil the whole topic down to this: utilities use live data, short-term forecasts, and automated control to cut peak load, move EV charging, dispatch batteries, steady voltage, and respond to faults faster.
Here’s the short version:
- Why this matters: Solar, wind, home batteries, and EV charging have made grid demand less predictable.
- What ML does: It forecasts load, flags odd behavior, and sends control signals to storage, flexible loads, and voltage equipment.
- What data it needs: AMI meters, SCADA/EMS, PMUs, DER telemetry, weather feeds, and price data.
- What models are common: LSTM, GRU, Transformer, gradient boosting, CNN, GAN, ANFIS, and reinforcement learning.
- How it works in practice: The grid predicts a peak, then shifts load, charges or discharges batteries, and adjusts voltage before assets get stressed.
- What teams track: Forecast error, peak reduction in MW, outage metrics like SAIDI/SAIFI, curtailment, and cost savings in $.
- What gets in the way: Dirty data, model drift, cyber risk, old field gear, and U.S. compliance rules.
- How to start: Pilot one use case first, such as feeder-level EV charging control, short-term forecasting, or battery peak shaving.
A few numbers stand out. AI-based systems can react in under 1 second. Demand response in U.S. ISO/RTO markets reached 32,421 MW in 2021. And DERs plus demand flexibility are projected to add 262 GW from 2023 to 2027, close to the 271 GW expected from bulk generation additions.
If you want the plain-English takeaway, it’s this: machine learning does not replace grid hardware or human review. It adds a prediction and control layer that helps utilities act earlier and with tighter timing.
| Area | What to know |
|---|---|
| Grid problem | Demand and supply now change faster and with more local swings |
| ML role | Forecast, detect issues, and guide control actions |
| Main assets controlled | Batteries, EV chargers, HVAC, water heaters, voltage/VAR devices |
| Fastest use cases | Short-term forecasting, feeder balancing, fault response |
| Main limits | Data quality, latency, cyber risk, and field integration |
Below, I sum up how the data, models, control setups, and pilot steps fit together in a U.S. grid setting.
The Data and Models Behind ML-Based Load Balancing
Core Data Sources Used by Smart Grids
Smart grids pull in customer, substation, and field data from several systems at once. Advanced Metering Infrastructure (AMI) smart meters track high-resolution electricity use at the customer level. SCADA and EMS systems show real-time substation and feeder conditions. Phasor Measurement Units (PMUs) add high-frequency voltage and phase-angle readings. On top of that, DER telemetry from solar inverters, battery systems, and EV chargers helps utilities see what’s happening with local generation and storage.
Utilities also mix in weather signals like temperature, humidity, wind speed, and cloud cover, along with live market and tariff data. Getting the timing right across all of these sources is a big deal. If the timestamps don’t line up, the model starts from shaky ground. Forecast accuracy drives 60% to 80% of control performance.
Before any model goes to work, the data needs cleanup. That usually means:
- filling gaps
- filtering noise
- normalizing values
- segmenting time series
Utilities also use digital twins to test AI control policies against past grid behavior before moving into live settings.
Once those data feeds are in place, the next step is picking the right model for each job.
Main ML Methods Used for Grid Decisions
Utilities don’t pick models at random. They weigh speed, accuracy, and how easy the model is to inspect. Common operating targets include MAPE below 2% for 1-hour forecasts and control latency under 100 milliseconds.
Different grid tasks lean on different ML methods.
| Model Type | Typical Application | Key Metric | Common Model |
|---|---|---|---|
| Forecasting | Market bidding / unit commitment | MAPE < 2% (1-hour) | LSTM, Transformer, GRU |
| Control | Voltage / VAR optimization, dispatch | Latency < 100 ms | DRL, ANFIS, reinforcement learning |
| Anomaly / Fault Detection | Fault classification, theft detection | Accuracy > 95% | CNN, BiLSTM, GAN |
| Optimization | Economic dispatch, storage scheduling | Lower operating cost | Linear / quadratic programming |
For very short-term forecasting, usually in the 5- to 60-minute range, utilities often use gradient boosting and LSTM models for automatic generation control and economic dispatch. For day-ahead forecasting, Transformer-based models with self-attention tend to handle long seasonal patterns better than older recurrent systems.
Control is a different beast. In messy, multi-agent settings like microgrid coordination, deep reinforcement learning can work well. ANFIS, by contrast, gives operators more visibility into voltage control decisions. That matters in practice. If a system is going to automate dispatch, operators need to see why it made a call and be able to check it later.
Infrastructure Needed to Run ML Models
A trained model alone won’t run a grid. Production systems need the full stack around it: time-series databases, ML frameworks, and optimization solvers.
The compute layer is usually split between cloud and edge. Cloud systems handle heavier training jobs and large simulation workloads. Edge devices, placed at substations or on distribution hardware, run smaller models close to the action for control decisions that need to happen in under 100 milliseconds. That local speed is what keeps the setup usable when timing gets tight.
These ML systems also need direct links to energy management systems (EMS), distribution management systems (DMS), and distributed energy resource management systems (DERMS). On top of that, utilities need version control, stress tests for extreme weather, and documented rollback plans before anything goes live.
That stack is what turns ML-based load adjustment from a lab demo into something utilities can run across the grid.
sbb-itb-501186b
How Smart Grids Use Machine Learning in Real Time
Forecasting Load Before Peaks and Imbalances Occur
Once the data pipeline and models are set up, smart grids shift from simple prediction to real-time control. As live data comes in, ML forecasts load across several time windows: seconds to minutes for anomaly detection, minutes to hours for dispatch and peak shaving, and days to seasons for capacity planning.
Different models handle different parts of the job. Transformers track seasonal demand patterns, GANs model rare peak events, and GRUs tighten short-term load forecasts when demand starts to swing. Working together, these hybrid models have reached a reported 99.49% accuracy on benchmark datasets such as Pecan Street.
That matters because a forecast is only useful if the grid can act on it in time. When the system sees a peak forming, it can trigger demand response, dispatch stored energy, or coordinate virtual power plants before the grid comes under stress.
Forecasts only matter when controllers turn them into load shifts, storage dispatch, and voltage setpoints.
Adjusting Demand, Storage, and Voltage Based on Grid Conditions
When a peak is on the horizon, ML controllers coordinate batteries, flywheels, smart thermostats, industrial HVAC, and EV chargers while staying within transformer and line limits. The idea is simple: shift or trim demand before equipment gets pushed too hard.
AI can also target customer groups for automated demand response. That might mean cycling water heaters or adjusting HVAC output, but only within comfort and safety limits. In U.S. ISO/RTO markets, demand response participation reached 32,421 MW in 2021, which was about 6.6% of peak load.
Managed EV charging is another strong use case. Instead of letting everyone plug in at 6:00 p.m. and hit the same transformer at once, AI sets "ready by" times and minimum charge levels so EV demand moves into off-peak hours. That helps cut the risk of local transformer overload during evening surges.
The same control loop that shifts demand also handles voltage and reactive power to keep local circuits steady. Hybrid ML controllers that combine ANFIS and Transformer models have cut system energy loss to 3.10%, which is a 54.4% improvement over standalone Transformer models.
Improving Stability, Fault Response, and Power Flow Control
The last layer of real-time load balancing is about keeping problems from spreading. ML-enhanced grids can spot congestion and instability early, which gives operators more room to respond.
Dynamic line rating updates transmission line capacity in real time based on weather conditions, instead of relying on fixed conservative limits. Topology reconfiguration gives the grid another option: reroute power around trouble spots, cut load shedding, and help service come back faster after a disruption.
When faults happen, ML-based fault location, isolation, and service restoration (FLISR) helps utilities find the issue faster and restore service with less delay. Symmetry-aware models learn normal demand and generation behavior, then switch into disturbance handling when conditions shift. Even then, operator overrides and equipment limits still stay in place during high-stakes events.
Those actions depend on control design, latency, and feedback metrics.
Artificial Intelligence for Power Grid Optimization | Load Forecasting & Control
Control Architectures, Performance Metrics, and Model Trade-Offs
ML Methods for Smart Grid Load Balancing: Models, Metrics & Control Architectures
Once the grid spots a peak or an imbalance, the next issue is simple: how fast can it react? That depends on the control setup.
Centralized, Decentralized, and Federated Control Approaches
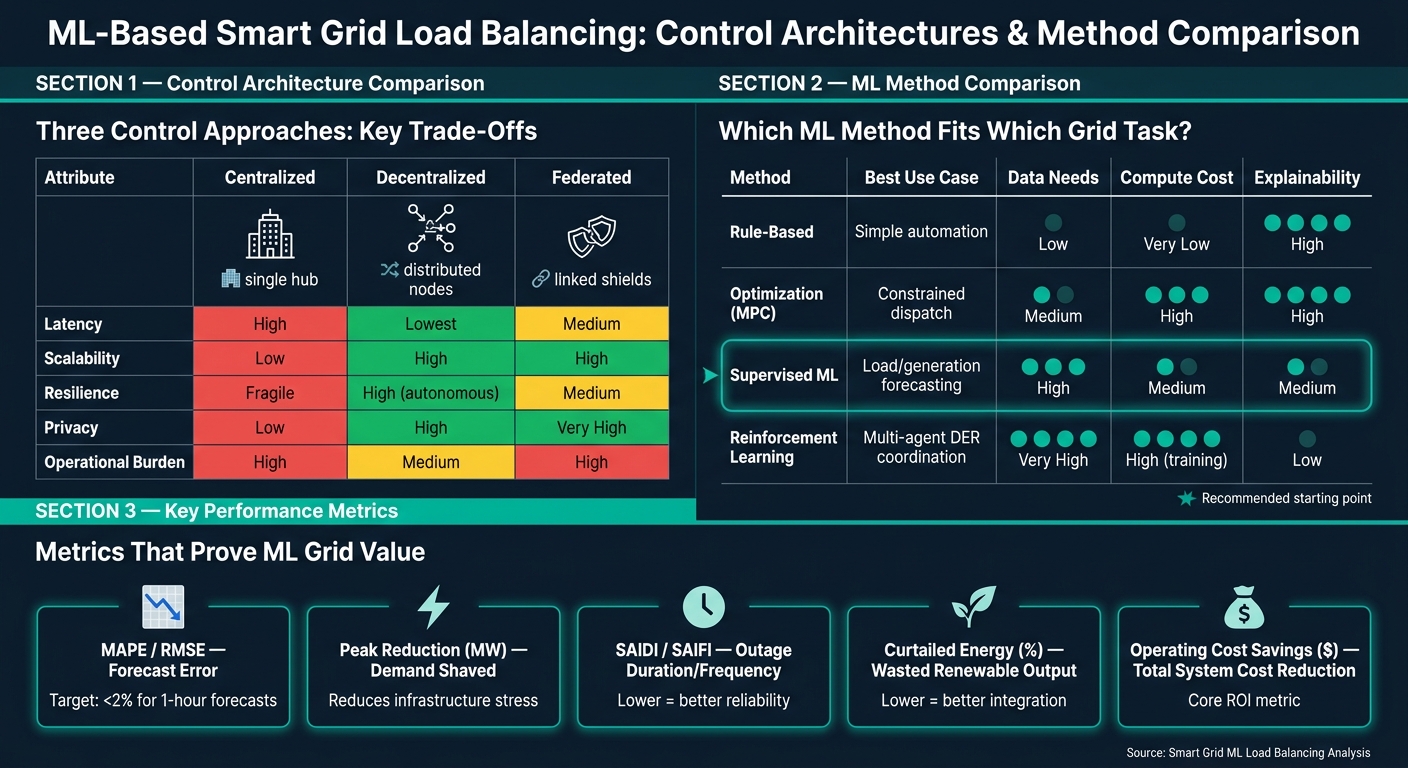
How a grid turns an ML forecast into a control action depends a lot on its architecture. The three main approaches each make different trade-offs around speed, privacy, and resilience. That choice shapes how fast - and how safely - the grid can respond.
Centralized control gives a utility full grid-wide visibility through a central EMS/SCADA system. That helps with system-level optimization, but it also creates a single point of failure and adds communication delay that can slow response times. Decentralized control pushes decision-making to local controllers at microgrids or load centers. Those controllers act on local measurements, which cuts the effect of communication delay and helps the system keep running even if communications drop out. Federated learning sits in the middle. Multiple facilities or utilities train models on their own data and share only model updates, not raw telemetry. That helps protect privacy while still improving forecast performance across the network.
| Architecture | Latency | Scalability | Resilience | Privacy | Operational Burden |
|---|---|---|---|---|---|
| Centralized | High | Low | Fragile | Low | High |
| Decentralized | Lowest | High | High (autonomous) | High | Medium |
| Federated | Medium | High | Medium | Very high | High |
In practice, most deployments don’t go all-in on just one model. They mix centralized planning with local fast-response control.
Closed-Loop Control and the Metrics That Matter
The path from forecast to action usually follows a five-step loop: predict → optimize → dispatch → measure → retrain. First, the ML model produces a short-term load or generation forecast. Then a decision engine - usually Model Predictive Control (MPC), Reinforcement Learning, or ANFIS - calculates dispatch signals within hard operating limits. Those signals are sent to batteries, DERs, or demand-response targets, and the grid’s response feeds the next training cycle.
Forecast accuracy drives control performance. If the forecast is off, the rest of the loop starts to wobble. That’s why operators track metrics tied to reliability, cost, and peak reduction. MAPE and RMSE show forecast error. Peak reduction (MW) shows how much demand gets shaved at the top end. SAIDI and SAIFI track reliability effects. And operating cost savings plus curtailed renewable energy (%) connect system behavior to business results.
| Metric | What It Measures | Why It Matters |
|---|---|---|
| MAPE / RMSE | Forecast error | Lower values indicate better prediction |
| Peak Reduction (MW) | Demand shaved at peak | Reduces infrastructure stress and capacity costs |
| SAIDI / SAIFI | Outage duration / frequency | Lower values indicate improved reliability |
| Curtailed Energy (%) | Wasted renewable output | Lower values mean better renewable integration |
| Operating Cost Savings ($) | Total system cost reduction | Core ROI metric for decision-makers |
These metrics show whether a model helps grid operations, not just whether it makes decent predictions.
Traditional Methods vs. ML Models: A Direct Comparison
With the control loop in place, the next step is choosing the right method for the job.
Rule-based systems and classical optimization methods like MPC are still common. They’re fast to deploy and easy to audit, but they tend to struggle with the nonlinear, time-varying behavior of modern loads.
ML-based methods handle that variability better, but they bring their own trade-offs. Supervised models work well for load and generation forecasting. Reinforcement learning can help with multi-agent coordination. The catch is that deep learning and RL are often harder to audit, they need large amounts of clean telemetry, and RL can be unstable during training.
| Method | Best Use Case | Data Needs | Compute Cost | Explainability |
|---|---|---|---|---|
| Rule-Based | Simple automation | Low | Very low | High |
| Optimization (MPC) | Constrained dispatch | Medium | High | High |
| Supervised ML | Load / generation forecasting | High | Medium | Medium |
| Reinforcement Learning | Multi-agent DER coordination | Very high | High (training) | Low |
For many teams, the practical answer is a hybrid setup. Using supervised ML for forecasting and MPC for safe dispatch keeps hard constraints in place while still getting the accuracy gains of newer models. ANFIS-based controllers also add fuzzy logic, which can make outputs easier for operators to interpret.
Human oversight is still standard in high-stakes grid control. The right fit comes down to data quality, latency, and how much operator review the system needs. The next constraint is data quality, cybersecurity, and field readiness.
Implementation Challenges and Next Steps
Data Quality, Cybersecurity, and Compliance Requirements
Once ML control is in place, success comes down to something less flashy: data, security, and compliance.
The biggest roadblock is usually the data layer. Many grid operators are still working with fragmented legacy systems and data that doesn't move cleanly through APIs. ML models are sensitive to noisy, missing, or uneven inputs, so even a well-built model can fall short when telemetry and sensor data haven't been standardized.
Model drift is another problem that often gets brushed aside. As EV adoption grows and extreme weather becomes more common, past load patterns stop being a reliable guide. That creates gaps in forecasting, especially around rare peaks and system imbalances that older models tend to miss.
Cybersecurity is moving up the list fast. Smart grids add more connected endpoints through IoT devices and DER telemetry, which means more places for attackers to get in. Cyberattacks on energy utilities have tripled over the past four years, and AI now cuts both ways: it can help defend the grid, and it can also be used against it. On the defense side, AI-powered anomaly detection can spot potential cyberattacks on IoT-connected grid endpoints in real time.
For U.S. deployments, teams also need to line up with the rules that govern the grid. That includes NERC reliability standards and project structures that fit FERC Order No. 2222, which allows distributed resources to participate in wholesale markets. NERC still requires human oversight for AI/ML in high-stakes grid operations. Field equipment also needs IEEE-compatible protocols so it can work with SCADA and DER systems.
How to Start a Pilot and Upgrade Field Equipment
After the compliance baseline is set, the smart move is to start small and test one use case well before trying to scale.
Good entry points include feeder-level EV managed charging, short-term load forecasting, and battery dispatch for peak shaving. These are lower-risk ways to test ML in live operations. ROI usually takes 6 to 12 months to show up, so it's worth setting that expectation early with internal teams.
The ML layer also depends on the gear underneath it. If the field infrastructure can't produce the right data, the model won't have much to work with. In practice, that means upgrading to smart transformers, advanced breakers, and IoT-connected sensors that can deliver the interval-level load data ML models need.
A few upgrades tend to matter most:
- Advanced Metering Infrastructure (AMI) for better visibility into usage patterns
- DER telemetry for assets like solar inverters and EV chargers
- Edge control for actions that need to happen in under 100 ms
- Cloud systems for model training and system optimization
The pilot itself should be treated like a live production system from day one. That means putting real performance checks in place and scaling only after the pilot proves forecast accuracy, response time, and measurable peak reduction.
Conclusion: Key Points for U.S. Grid and Facility Decision-Makers
For U.S. operators, the next step isn't broad automation. It's a disciplined rollout with clear proof at each stage.
ML improves load balancing only when data pipelines are clean, field equipment can support the workload, and human oversight is built into the control setup. In plain terms, success rests on four things: high-quality data pipelines, standards-aware integration with existing SCADA and distribution automation systems, cybersecurity controls that match the larger attack surface of connected grids, and pilots that prove value before expansion. The main limit isn't what the tools can do. It's whether teams can execute well.
"Accurate demand forecasting and intelligent load balancing are no longer optional optimization tools but essential components for maintaining grid stability." - Ata Larijani, Oklahoma State University
FAQs
How does machine learning improve load balancing?
Machine learning helps load balancing by looking at large sets of data to predict electricity demand and renewable energy output. It spots patterns in power use and weather, which helps utilities line up supply and demand with less manual work.
It also supports real-time changes to grid flow and battery storage. That means operators can react faster, cut outage risk, keep grid frequency steady, and catch anomalies early. If something starts to go wrong, they can reroute power or deal with faults before the problem spreads.
What grid data is needed for ML models?
Machine learning models need data from across the grid to help balance loads and sharpen forecasting.
That usually means pulling from several sources at once. Historical power use and generation data show what happened before. Real-time sensor data adds a live view of grid conditions. AMI readings fill in the finer details by showing customer usage patterns at a much more granular level.
Weather data also plays a big part. So do calendar patterns, including holidays and local events that can shift demand in ways utilities can’t ignore. On top of that, teams often factor in local socioeconomic activity or industry operating schedules, since those can shape when and how power gets used.
Equipment health data matters too. Inputs here can include three-phase load currents, transformer oil levels, and equipment temperatures. Put together, these signals give models a much better picture of what’s happening across the grid and what may happen next.
What is the best first smart grid ML pilot?
The most effective first smart grid machine learning pilot is load forecasting. It gives operators a solid starting point for predicting electricity demand and renewable generation before they make balancing decisions.
Proven models like LSTM networks and Random Forest can improve accuracy, which helps cut costs and prevent outages. Electrical Trader supports the physical rollout of these systems with equipment such as transformers and power distribution components.