

Predictive Maintenance in Medium Voltage Motor Control
One MV motor trip can shut down a pump, compressor, or full process line - and the fix can cost far more than the part that failed.
If I had to sum up this topic in a few lines, I’d say this: predictive maintenance uses data to decide when to service MV motor control equipment before it fails. In U.S. plants running 2.4 kV, 4.16 kV, 6.9 kV, or 13.8 kV motors, that usually means watching temperature, current, vibration, insulation test results, relay alarms, start times, and partial discharge. Then I turn those signals into alarm rules, health scores, work orders, outage plans, and parts orders.
Here’s the core idea in plain English:
- Run-to-failure waits for a breakdown
- Time-based maintenance follows a set schedule
- Predictive maintenance uses condition data and trend changes
What matters most:
- Motors, contactors, relays, bus joints, cable terminations, CTs/PTs, and control power all affect maintenance calls
- Early warning signs often show up as heat, vibration, trip repeats, longer start times, insulation decline, or voltage/current imbalance
- Alarm logic needs delays, hysteresis, and more than one signal so teams don’t get flooded with bad alarms
- Health scores help rank which motor or MCC cell needs attention first
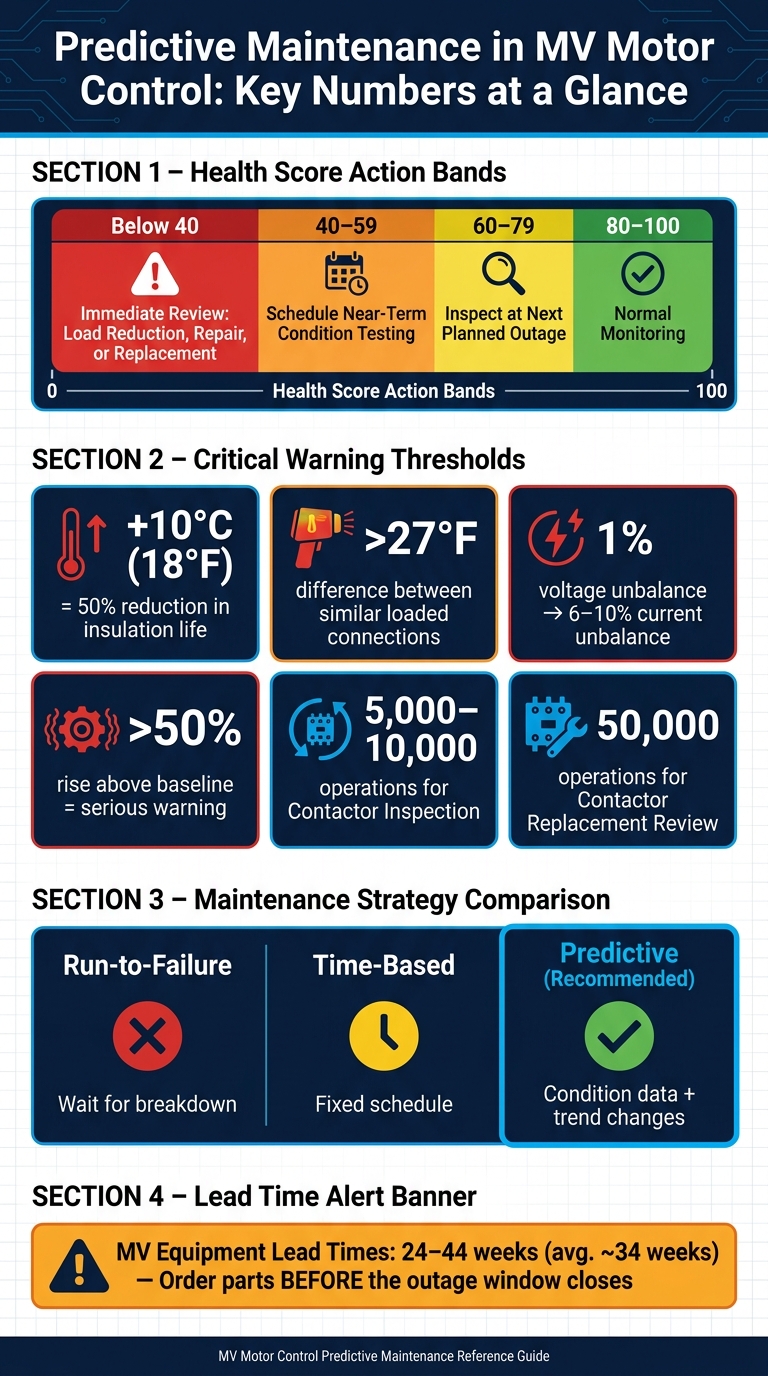
- Parts timing matters because MV gear can have lead times of 24–44 weeks, with about 34 weeks being common
-
Common action bands are:
- 80–100: keep watching
- 60–79: inspect at the next outage
- 40–59: schedule near-term testing
- Below 40: review load reduction, repair, or replacement now
A few numbers stand out:
- A 10°C (18°F) temperature rise can cut insulation life by about 50%
- More than 27°F temperature difference between similar loaded connections is a warning sign
- A 1% voltage unbalance can drive about 6%–10% current unbalance
- Vibration that climbs 50% above baseline needs attention
- Some vacuum contactors should be checked around 5,000–10,000 operations, with replacement review around 50,000 operations
If you want fewer surprise outages, the path is simple: watch the right signals, score asset condition, plan outage work early, and order long-lead parts before the window closes.
MV Motor Control Predictive Maintenance: Key Thresholds & Health Score Action Bands
What is predictive maintenance on electric motors - high power motors
sbb-itb-501186b
Medium Voltage Motor Control Center Parts That Drive Maintenance Decisions
Predictive maintenance starts with knowing which MCC parts give you data you can use. The way the MCC is laid out shapes what you can track, what you can test, and where your team still has to lean on past inspections.
Main Compartments and Power Path
A medium voltage MCC is a metal-enclosed, compartmented assembly with separate, interlocked sections for switching, protection, and control.
Power comes in from upstream switchgear or a feeder, moves through the main bus, and then branches into individual motor starter cells. The bus uses copper bus and may be insulated or segmented to help limit fault propagation.
Inside each cell, power flows through the MV power cell compartment. That path includes the incoming disconnect or breaker, current-limiting fuses where used, and a vacuum contactor before power exits through the load cables to the motor. Instrument transformers support protection and metering.
A separate low-voltage control compartment contains the protective relay, control power transformer or supply, PLC or DCS interface terminals, and auxiliary devices. Teams can access this area while the MV cell stays closed and interlocked.
The cable termination area is where shielded MV cables connect to the motor, using stress cones or separable connectors. Isolation barriers and pressure relief paths run through the enclosure to contain arc energy and keep control wiring apart from MV conductors.
Components Most Often Monitored
Not every MCC part gives the same kind of signal. Some components feed continuous data into a relay or monitoring system. Others only tell their story during a shutdown, an IR scan, or a scheduled test. That difference matters because it shapes when maintenance shifts from “watch it” to “replace it.”
| Component | Usable Data | Main Monitoring Method |
|---|---|---|
| Vacuum contactor | Operation count, coil timing, contact wear | Relay logs, timing tests, operation counters |
| Protective relay (microprocessor) | Event logs, trip history, self-diagnostics, motor start data | Continuous via relay communication |
| Motor (RTDs, vibration) | Winding temperature, bearing vibration, insulation resistance | Online sensors, periodic offline tests |
| Bus connections | Temperature at joints, partial discharge | IR thermography, PD sensors |
| Cable terminations | Partial discharge, surface temperature, leakage current | Online PD monitoring, IR scans |
| Control power supply | Output voltage stability, alarm contacts | Online monitoring, periodic inspection |
| Current-limiting fuses | Blown-fuse events, fault history, age | Inspection-based, age/replacement policy |
| CTs and PTs | Relay input quality and periodic test results | Periodic insulation and ratio tests |
Protective relays provide some of the richest condition data in an MCC: event logs, oscillography, starting current trends, and self-diagnostic status. If you want a component that can tell you what happened, when it happened, and what the motor was doing at the time, this is usually it.
Vacuum contactors also stand out. Operation counts and coil timing trends can show wear before a mechanical failure shuts the cell down. That makes them a strong fit for predictive maintenance models.
Other parts are less talkative. Fuses and instrument transformers still depend a lot on inspection history and periodic testing instead of live condition data.
Sourcing Replacement and Upgrade Parts
When condition data points to rising wear, the job shifts from monitoring to buying. That extra lead time gives teams a chance to source replacement parts through Electrical Trader before the outage.
With the main parts mapped, the next step is spotting which failures these sensors and alarms reveal first.
Common Failure Points and Early Warning Signals
These faults usually show up in the data first. Trends, alarm logs, and offline testing often catch trouble before it turns into an outage. Relay data, RTDs, vibration sensors, and thermography make the pattern visible early.
Motor Failures: Insulation, Bearings, Heat, and Rotor Problems
MV motor failures usually begin in four areas: insulation, bearings, cooling, or the rotor. And each one leaves a trail - temperature, vibration, current, or trip history.
Stator insulation wears down from heat, moisture, and contamination over time. The U.S. Department of Energy notes that for every 18°F (10°C) rise in operating temperature, insulation life is cut roughly in half. That’s a harsh tradeoff. During planned outages, teams often trend megohm readings and polarization index (PI) values to see where things are heading. A PI below 1.5 or insulation resistance below 5 megohms calls for a closer look. If ground-fault alarms keep showing up while insulation readings keep slipping, that usually points to moisture ingress or thermal degradation - not a one-off issue.
Bearing problems usually give some warning before they force a shutdown. The first clues are often bearing temperature and vibration. A vibration increase of more than 50% above a well-set baseline is a serious warning sign. Spectral analysis helps sort out what’s going on, so teams can tell bearing damage apart from unbalance or misalignment.
Rotor bar faults are trickier. Early on, temperature and vibration may still look normal. But if a motor that normally reaches speed in seconds starts taking longer under the same load, that’s a red flag. Current signature analysis can spot broken rotor bars or cracked end rings weeks to months before other symptoms show up. That extra time matters. It gives maintenance teams room to test, plan, and replace parts before the next outage window closes.
| Symptom | More Likely Root Cause | Useful Check |
|---|---|---|
| Rising winding temperature at normal load | Poor cooling, overload, insulation aging | Compare phase temperatures, check filters and fans |
| One bearing hotter than the other | Bearing distress, misalignment, lubrication problem | Compare bearing temperatures and vibration |
| Vibration rising at 1× speed | Rotor unbalance | Alignment and rotor inspection |
| Vibration rising at 2× speed | Misalignment or looseness | Alignment check, mounting inspection |
| Longer start time, weak acceleration | Rotor bar fault, voltage drop | Current signature and start trend review |
| High current with low or unbalanced voltage | Supply issue, loose connection | Measure voltage per phase under load |
Control Equipment Failures: Contactors, Breakers, Bus, and Relays
Contactor and breaker wear tends to show up as hot contact joints, higher millivolt drop, slower open and close times, or odd noise. Operation counts matter here. As a contactor gets close to its manufacturer-rated mechanical life, the opening and closing times recorded by the control system often start to drift.
Loose bus connections and terminations are one of the most common early problems in MCCs. Even a small loss of tightness in a bolted joint can increase contact resistance. That added resistance creates heat, and heat can turn into burned lugs or arc faults if nobody steps in. Energized infrared thermography under load is usually the most practical way to catch it: a temperature difference of more than 27°F between similar loaded components is a sign that needs attention. Looking at repeated scans over time - not treating one scan like the whole story - helps teams decide which terminations should be retightened or re-terminated during the next scheduled outage.
Relay and instrument transformer problems often get mistaken for motor or feeder faults. If the same trip happens again and again at the same load, but there’s no matching thermal damage, the trouble often sits in relay settings, CT wiring, or firmware - not in an actual power event. A simple cross-check helps here: compare relay-measured quantities with an independent reference during periodic maintenance to confirm whether CT and PT inputs are still accurate.
Environmental and Operating Conditions That Speed Up Wear
The area around MV motors and MCCs has a direct effect on how fast parts wear and how alarm thresholds should be set. In U.S. Gulf Coast or Southwest sites, motor room temperatures can run above 100–105°F. When equipment lives near its temperature class limit, it ages faster than nameplate ratings assume.
Voltage unbalance is one of those problems that looks small on paper but hits hard in service. A 1% voltage unbalance can produce roughly 6–10% current unbalance, which pushes winding temperatures up fast. The DOE recommends derating motors when voltage unbalance goes above 1%, and motors should never run on a system with more than 5% unbalance. So when current imbalance shows up in trend data, the next move is usually to check voltage per phase under load and compare that with thermal imaging of terminations and bus. That helps separate a supply or connection issue from an internal winding fault.
Dust, humidity, and corrosive contamination make the whole picture worse. Conductive dust can interfere with cooling and lead to tracking. Humidity above 80% relative humidity speeds up insulation degradation, especially when temperature swings cause condensation. In harsh settings, it makes sense to assign higher criticality, inspect more often, lower temperature alarm points, and shorten replacement cycles for contactors and terminations.
Those signals feed straight into alarm logic and priority scoring. On their own, they’re just data points. They become useful when automation turns them into alarms, health scores, and work priorities.
Automation Inputs, Alarm Logic, and Health Scoring
These signals only matter when automation turns them into maintenance decisions people can actually use.
Inputs from Sensors, Relays, Drives, and Control Systems
Predictive maintenance begins when raw data becomes alarms, trends, and health scores. In MV motor control, the most useful inputs usually fall into four buckets: electrical measurements from CTs and PTs, such as current, voltage, harmonics, and THD; thermal data from RTDs in stator windings and bearings, along with thermistors tied to overload relays or drive inputs; mechanical condition data from vibration sensors on bearing housings; and operating records like starts, run hours, trip logs, and start profiles from drives or soft starters.
Some RTD monitoring boards can also detect partial discharge through the same wiring. For online PD monitoring on MV motors, capacitive couplers at the motor terminals are a common setup.
From there, the data moves through a layered system. PLCs and relays handle local logic. SCADA or DCS shows live status and alarms. Historians keep the long-term trends. Common protocols include Modbus, EtherNet/IP, PROFINET, and IEC 61850. Critical electrical values may scan every second, while temperatures may update every 1–5 minutes.
Alarm Logic That Supports Maintenance Without Adding Noise
The hard part isn’t finding a signal. It’s keeping the system from crying wolf.
Delays, hysteresis, and multi-condition logic help filter noise. Typical delay ranges are 60–300 seconds for temperature and vibration, 5–30 seconds for current and voltage, and trend-based alarms for partial discharge. In practice, multi-condition logic often does the heavy lifting. A high bearing temperature alarm means much more when it shows up with higher vibration and a recent jump in motor starts, instead of firing on temperature alone.
Partial discharge works the same way. A rise in PD magnitude or repetition rate over time - especially when paired with high humidity or records of aging insulation - is usually a better warning sign than one threshold crossing by itself.
Many U.S. plants now lean toward trend-based alerts instead of fixed limits. In plain English, the system looks for drift from a learned baseline instead of waiting for a static number to trip. That can catch slow faults that stay under a set limit until the damage is already done.
Once the alarm layer is cleaned up, the next move is to roll those signals into a single asset-level score.
Health Scores and Work Priorities
A health score turns many inputs into one score for each motor or cell. The usual method is simple: normalize each factor to a 0–100 scale, where 100 means the asset is in top condition and 0 means it has failed, then weight each factor based on how closely it relates to catastrophic failure. Insulation health - including temperature trends, PD levels, and prior ground faults - and mechanical health - including vibration, bearing temperature, and start frequency - often get the heaviest weights, around 25% to 30% each, because they are closely tied to unplanned MV motor outages. Asset age, run hours, trip history, and site conditions make up the rest.
Those numbers then map straight to action:
- 80–100: stay on normal monitoring
- 60–79: inspect at the next planned outage
- 40–59: move up for near-term condition-based testing, such as insulation resistance testing or a vibration survey
- Below 40: start an immediate review for load reduction, accelerated maintenance, or replacement planning
At that point, the score stops being just a dashboard number. It drives work orders, outage timing, and parts orders.
Using Predictive Data to Plan Service and Cut Unplanned Downtime
From Trend Data to Work Orders and Outage Planning
A health score only matters if it leads to action. When a score moves into risk territory, the job is to turn that warning into scheduled work. Use historian trends, alarm history, and CMMS planning to set the timing, scope, labor, and parts for the job.
For example, a steady climb in contactor and cable-termination temperatures can be enough to justify a short planned outage. That outage can cover termination inspection, compartment cleaning, and contactor replacement before a failure hits. In the same way, a rising bearing-vibration trend should push bearing replacement into the next planned outage, instead of waiting for the next breakdown.
This same trend window should prompt a procurement review before the outage date starts to drift. It also makes sense to group related tasks into one shutdown window, such as:
- Infrared scanning
- Relay testing
- Bus cleaning
Bundling this work helps cut total downtime.
Spare Parts Planning and Procurement Timing
Predictive data gives procurement teams lead time measured in weeks or even months.
For medium voltage motor control, the parts that usually matter most for lead time planning include vacuum contactors, protective relays, instrument transformers, fuses, and large motors. Custom motor control centers in North America can come with lead times of 24–44 weeks, with an average of about 34 weeks. So if an asset starts to degrade today, the replacement order may need to go out this week to land in time for a planned outage six months from now.
Predictive analytics also help teams stock parts with more confidence. A common recommendation for critical vacuum contactors is to keep at least one complete spare on-site when supplier lead times run past 5–15 days. Operation count trending helps here too. Some manufacturers recommend inspection every 5,000–10,000 operations and say teams should start weighing replacement at 50,000 operations. That gives maintenance and purchasing teams a clear basis for stocking decisions instead of relying on gut feel.
When an asset falls into the 40–59 range, or when lead times stretch past the next outage window, planned replacement is often the smarter move. Electrical Trader can help source hard-to-find MV components when OEM lead times are too long.
Conclusion: Key Steps for Predictive Maintenance in MV Motor Control
Predictive maintenance works when condition data turns into scheduled work. Use health scores to rank assets, tie work orders to outage windows, and order long-lead parts early. That cuts unplanned outages and keeps maintenance aimed at the highest-risk equipment.
FAQs
What data matters most for MV predictive maintenance?
The most important MV predictive maintenance data comes from electrical, mechanical, and thermal readings. Together, these readings establish a health baseline for the equipment.
The main signals to watch include current draw, voltage, partial discharge, vibration, winding and oil temperatures, infrared thermography, insulation resistance, contact resistance, and dissolved gas analysis. When teams track these trends over time, they can spot early signs of degradation and plan service before a failure hits.
How do I set useful alarm thresholds without nuisance alarms?
Start with a 30- to 60-day baseline of normal equipment behavior. That gives you a clear picture of what “normal” looks like before you start tuning alerts.
From there, use threshold filtering and data correlation so alerts point to issues that matter, in the right operating context. That way, the system isn’t flagging every small blip as a problem.
In automated systems, dual-channel transmitters help add a layer of protection. If one channel fails, it should trigger an alarm, not a trip. Built-in time delays also help screen out harmless current surges that don’t need action.
As maintenance teams find and fix issues, feed those results back into the system. That lets you keep adjusting thresholds over time, so alerts stay useful instead of turning into noise.
When should we repair, replace, or order MV spare parts?
Base repair-or-replace decisions on manufacturer documentation, diagnostic data, and a clear cost-benefit analysis. Don’t wait for a breakdown to force the call. Use predictive maintenance and real-time monitoring to catch declining equipment health weeks before failure, so you can order parts early and avoid a last-minute scramble.
Replace assets when repair costs go beyond 60% of a new unit’s price, or when the equipment is 15–20 years old. Some cases are more cut-and-dried: replace the unit at once if it’s physically damaged, non-resettable, or factory-sealed and compromised.