

Machine Learning in High-Voltage Power Systems
Machine learning is helping utilities find transformer, breaker, cable, and substation problems earlier - often before a failure turns into an outage.
If I had to boil this article down to the main point, it would be this: ML works best when utilities have clean sensor data, enough past events, and a clear path from model alert to maintenance action. The strongest research results in this article center on transformers and OLTCs, with one DWT-SVM study reporting 98.3% fault-classification accuracy on transformer lightning impulse faults from 170 kV to 650 kV.
Here’s the short version of what the research says:
- Fixed maintenance schedules are losing ground because assets do not age at the same rate.
- Condition-based maintenance uses actual asset data - like SCADA, DGA, vibration, acoustic signals, and waveforms - to guide service timing.
- Transformers and OLTCs get the most attention in the research, mostly because they produce long, structured data histories.
- Common models include SVM, ANN, Random Forest, XGBoost, and LSTM.
- Vibroacoustic monitoring is a big theme for OLTCs and breakers because it can flag wear and timing drift without teardown.
- The main limit is not model choice. It’s poor labels, sparse fault data, signal drift, and weak fit with maintenance workflows.
- The business payoff is simple: earlier repair decisions, less unnecessary disassembly, and more time to line up spares or replacements.
A few numbers stand out:
- 98.3% accuracy for transformer series fault classification in a DWT-SVM study
- 22,000 tap operations and 35,000 switching operations used in Hydro-Québec/IREQ OLTC work
- Data collected across nine 370 MVA, 735 kV autotransformers
- Study period from 2016 to 2023
Quick Comparison
| Area | What the research shows | Main data used | Main issue |
|---|---|---|---|
| Transformers | Strong fault classification results | Impulse waveforms, load history | Limited fault examples |
| OLTCs | Good anomaly detection for wear and timing drift | Vibroacoustic signals, tap counts | Signal drift over time |
| Circuit Breakers | Wear and arcing can be flagged from switching signatures | Acoustic/vibration data | Field noise and label quality |
| Digital Substations | Fleet health scoring and stability assessment | SCADA, smart meter, event data | Data consistency across systems |
Put another way: the promise is clear, but field use still depends on data quality and maintenance follow-through. That’s the lens I’d use for the rest of this article.
Machine Learning Models Used for Fault Detection and Failure Prediction
ML Models for High-Voltage Power System Fault Detection: A Comparison
Key Models in Recent Studies: ANN, SVM, Random Forest, XGBoost, and LSTM
Recent studies keep coming back to the same handful of ML models. That’s not by accident. Each one fits a different kind of failure-prediction job.
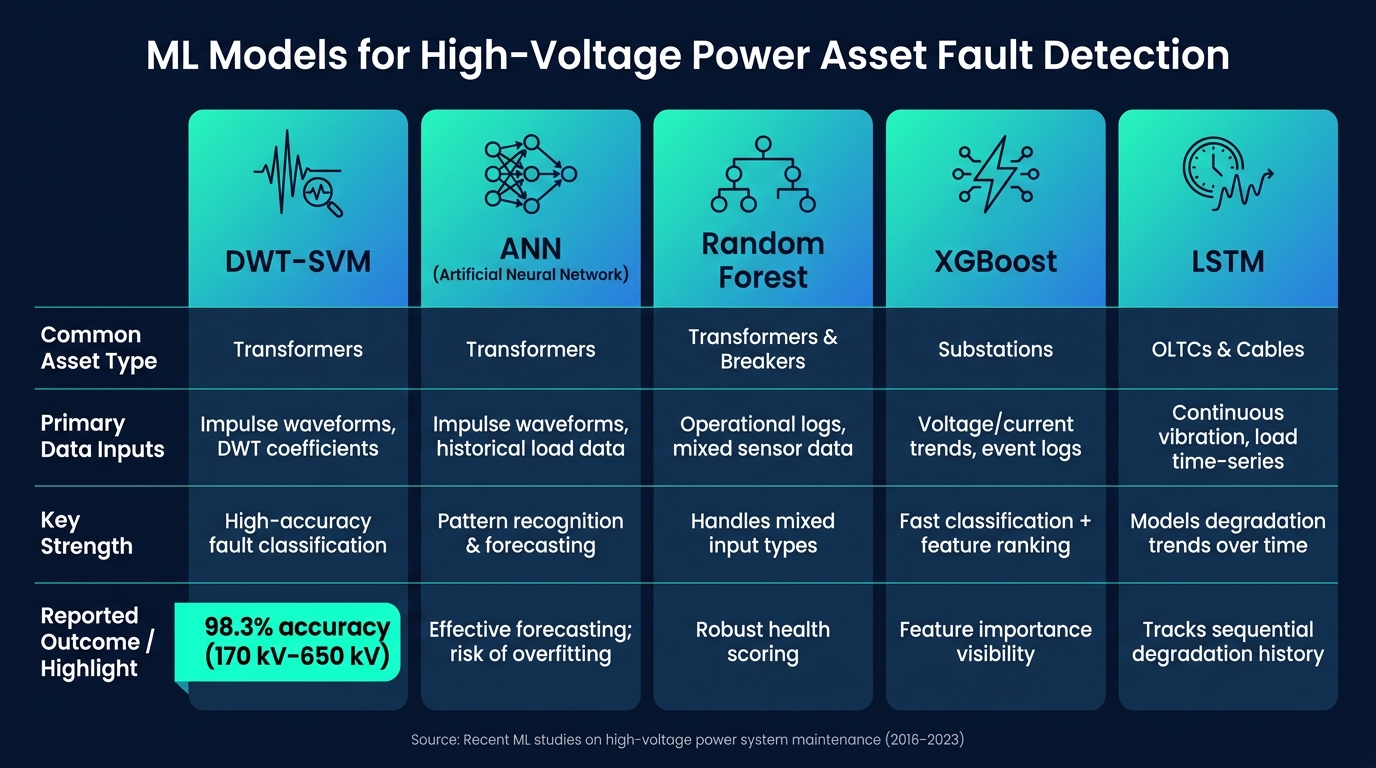
Support Vector Machines (SVM) work well for classification, especially when combined with signal processing. One good example comes from ACTOM High Voltage Equipment engineer Bafana Nyandeni, whose hybrid DWT-SVM model reached 98.3% accuracy when classifying transformer lightning impulse faults across BIL levels from 170 kV to 650 kV.
ANNs show up often in pattern recognition and forecasting. They can work well, but there’s a catch: ANNs may overfit when the faults used in training don’t line up with what happens in the field.
Random Forest models are a solid fit when the input data comes from different places and in different formats. That makes them useful for transformer and breaker health scoring, where you might combine operating records with sensor readings.
XGBoost is often used for fault classification when teams need fast results and want to see which features matter most. That’s especially handy in substation monitoring workflows.
LSTM networks fit sequential sensor data. In plain terms, they’re built for time-based patterns, so they’re often used to track degradation over time in assets with long operating histories.
| Model | Common Asset Type | Data Inputs | Reported Outcome |
|---|---|---|---|
| DWT-SVM | Transformers | Impulse waveforms, DWT coefficients | 98.3% accuracy for series fault classification |
| ANN | Transformers | Impulse waveforms, historical load data | Effective for forecasting; overfits with limited fault samples |
| Random Forest | Transformers, breakers | Operational logs, mixed sensor data | Robust to mixed input types; used in health scoring |
| XGBoost | Substations | Voltage/current trends, event logs | Fast classification with feature importance ranking |
| LSTM | OLTCs, cables | Continuous vibration, load time-series | Models degradation trends over sequential operating history |
What decides which model wins? Usually, it comes down to the input data. If the signal type, event history, or sensor stream changes, the best-fit model often changes with it.
Input Data Commonly Used to Train Maintenance Models
Hydro-Québec's Research Institute (IREQ) built its OLTC diagnostic system using data from 22,000 tap operations and 35,000 switching operations recorded across nine 370 MVA autotransformers (735 kV) from 2016 to 2023. That kind of depth matters. Sequential models like LSTM need long operating histories so they can learn what normal degradation looks like before they can flag drift or trouble.
For transformer insulation diagnostics, SVM and ANN models use impulse waveform parameters such as peak voltage, front time, tail time, time to chop, and overshoot. In OLTC monitoring, tap position and switching operation counts feed straight into health tracking models.
The hard part isn’t only model choice. It’s getting electrical, thermal, and mechanical data into one dataset that can actually be used, especially when fault examples are limited.
Those input patterns change from one asset class to another, which helps explain why the top results are different for transformers, breakers, and OLTC systems.
Research Findings by Asset Type: Transformers, Breakers, Cables, and Digital Substations
Transformers and Circuit Breakers: The Strongest Research Focus
The biggest gains show up in assets that produce long, structured operating data.
Transformers and OLTCs lead the pack in ML research. Studies on transformers report strong fault-classification results, especially with DWT-SVM models. In one set of studies, accuracy reached 98.3% across BIL levels from 170 kV to 650 kV, which helps teams locate faults faster and avoid unnecessary disassembly.
OLTC research takes a different path. These studies use vibroacoustic signals to spot wear and timing drift in a non-invasive way, without needing prior knowledge of known fault types.
That same vibroacoustic approach is now showing up in circuit breaker research too. Switching signatures can point to contact wear, loose springs, and arcing.
Digital Substations and Fleet-Wide Asset Health Scoring
At the fleet level, ML moves beyond single-asset diagnosis and into substation-wide health scoring.
When grid, SCADA, and smart meter data feed ML models, those models can support real-time stability assessment and broader asset health evaluation. In smart grid research, this is often described as a shift toward self-healing capabilities, where AI can support self-healing grid control under higher system stress from renewable energy and decentralized loads.
Here’s a simple view of how recent studies map ML use across asset types:
| Asset Type | Monitoring Method | Common ML Approach | Main Operational Benefit |
|---|---|---|---|
| Power Transformers | Lightning impulse waveforms | DWT-SVM hybrid | Up to 98.3% fault classification accuracy; less destructive inspection |
| On-Load Tap Changers (OLTCs) | Vibroacoustic signal envelopes | Anomaly detection | Non-invasive detection of mechanical wear and timing issues |
| Circuit Breakers | Vibroacoustic switching signatures | Anomaly detection models | Detection of contact wear, loose springs, and arcing |
| Digital Substations | SCADA and smart meter data | Neural networks and fuzzy logic | Real-time stability assessment and self-healing grid management |
Of course, results like these depend on strong data quality and solid validation, which the next section covers.
sbb-itb-501186b
Performance Results and Practical Limits in Deployment
Reported Gains in Accuracy, Warning Time, and Maintenance Planning
The key question isn't whether these models can work. It's how well they hold up once they leave the lab and face field conditions.
Recent studies report strong results, but there’s a catch: most of that success comes from narrow fault modes. Large labeled fault datasets are still hard to find, so many models continue to depend on sparse fault records or synthetic fault examples. In practice, that puts a ceiling on how far the results can carry.
Right now, deployment looks strongest for transformers. By contrast, digital-substation models still lean on field data that must be cleaner and more consistent than what many teams can easily collect.
Data Quality, Model Validation, and Workflow Integration
At this point, the main limits are not model availability. They’re data quality and day-to-day operational fit.
The biggest barriers are:
- limited fault data
- model sensitivity to training mismatches
- signal drift caused by changing conditions
Even when the model itself is solid, field signals don’t stay still. Vibroacoustic signals and other sensor inputs shift with temperature and seasonal changes. If teams skip time alignment or moving-average preprocessing, those normal swings can get flagged as equipment irregularities.
That creates a pretty common problem in deployment: the model may look strong on its own, yet struggle once it meets messy field data.
There’s also the workflow side of the story. A model can perform well in isolation and still be hard to use if it doesn’t fit existing asset management systems and maintenance processes. That gap between model output and maintenance action is often where deployment stalls.
Deployment works only when sensor data, labels, and maintenance workflows line up.
What These Research Findings Mean for Equipment Lifecycle and Sourcing
Using Predictive Insights to Plan Replacement, Refurbishment, and Spares
Once models are validated, the job changes. It’s no longer just about spotting a problem. It’s about deciding what to do next.
If a model points to a likely fault zone, maintenance teams can act sooner and with more focus. That might mean a targeted repair, a refurbishment, or a full replacement. The big win here is simple: earlier maintenance decisions.
That extra time matters. Early warnings give utilities more room to order spares, line up crews, and schedule replacements before an outage hits. In practice, that means better procurement timing. It also means spare-parts and replacement planning need to start early if the goal is to avoid unplanned downtime.
There’s another upside too. Teams spend less time investigating and do less unnecessary disassembly. For OLTCs, vibroacoustic monitoring can spot wear early enough to plan refurbishment during a scheduled outage. That kind of heads-up makes repair-versus-replace decisions a lot easier across the asset types covered in this article.
How Electrical Trader Supports Sourcing
Once risk is identified, the next question is pretty direct: how fast can you get the right part or asset?
When a model shows elevated risk, procurement becomes the next step. Electrical Trader can help source spares, refurbished units, or replacement assets such as breakers and transformers.
The action depends on the asset type:
| Asset Type | Predictive Maintenance Method | Maintenance Action | Equipment Category |
|---|---|---|---|
| Power Transformer | DWT-SVM waveform analysis | Targeted winding repair or replacement | High-Voltage Transformers |
| On-Load Tap Changer | Vibroacoustic signal analysis | Contact replacement or timing adjustment | Transformer Components |
| Circuit Breaker | ANN, SVM, Random Forest | Contact replacement or mechanism service | High-Voltage Switchgear |
| Cables / Insulation | Partial discharge monitoring | Sectional replacement or insulation refurbishment | HV Cables & Bushings |
| Digital Substation | AI-based security assessment | Communication hardware replacement | Digital Substation Components |
Key Takeaways From Recent Machine Learning Studies
The practical upside comes down to three things: earlier inspection, less unnecessary disassembly, and more time to source spares or replacements.
A lot of the active research is centered on transformers, circuit breakers, cables, and digital substations. And the strongest results tend to show up when the data is clean, well-labeled, and properly validated. As Hassan Ezzaidi and Issouf Fofana noted, "In the era of digitalization, advanced diagnostic techniques capable of detecting early signs of wear or malfunction are essential to enable preventive maintenance for these important components."
That same idea matters for sourcing just as much as it does for maintenance.
FAQs
Why does data quality matter so much for ML in high-voltage systems?
Data quality matters because an ML model is only as reliable as the data it gets. In high-voltage systems, signals are complex, always changing, and often noisy. If the data is messy, the model's output can be off too.
Missing values, uneven normalization, and noisy sensor readings all chip away at reliability. That’s why clean, standardized data is so important. It helps models spot patterns with better accuracy, supports predictive maintenance, and can help prevent failures like blackouts.
Which high-voltage assets benefit most from machine learning today?
Power transformers tend to see the biggest gains here. Machine learning can review dissolved gas, vibration, and temperature data to flag insulation degradation, winding faults, and mechanical displacement before those issues turn into failure.
Other major assets include generators and rotating equipment like gas turbines. In those systems, the same mix of electrical, thermal, and vibration monitoring can point to bearing wear and rotor imbalance early.
How do ML alerts lead to real maintenance decisions?
Machine learning alerts help teams stay ahead of equipment problems. They can spot small warning signs, like changes in vibration or a rise in temperature, that often show up before a machine fails.
By using real-time sensor data and predictive diagnostics, operators can check asset health, decide when action is needed, and cut risk by scheduling maintenance during planned outages.