Ultimate Guide to Green Power Distribution
Green power distribution is about one thing: building an electrical system that can handle two-way power, lower losses, and keep key loads online when the grid fails.
If I had to sum up this guide in plain English, it comes down to this:
- I need to plan for solar, batteries, EV charging, and future load growth from the start
- I need to check busbar limits, voltage rise, fault current, and protection settings before adding DER
- I should use low-loss transformers, DER-ready switchgear, and smart inverter settings
- I need monitoring, maintenance, and power-quality checks after startup, not just at design time
- I should follow NEC 705, 706, 710 and IEEE 1547-2018 so the system can connect and run the right way
The article also makes the cost case clear. Unplanned downtime can cost $50,000 per hour on average, and demand charges can reach 30% to 70% of a commercial power bill. On the performance side, good DER placement can cut feeder losses by 47% to 64%.
Here’s the short version of what matters most:
- Design for bidirectional power flow, not one-way utility supply
- Use 12 to 24 months of 15-minute load data to size PV and storage
- Check NEC 705.12 and 705.11 before choosing load-side or supply-side interconnection
- Review transformer loading for EV charging, since charging can speed up insulation aging
- Confirm AIC ratings and relay settings after DER is added
- Track SAIDI, SAIFI, THD, power factor, and carbon per kWh
- Use condition monitoring like DGA, PD, IR scans, and temperature trending to cut failure risk
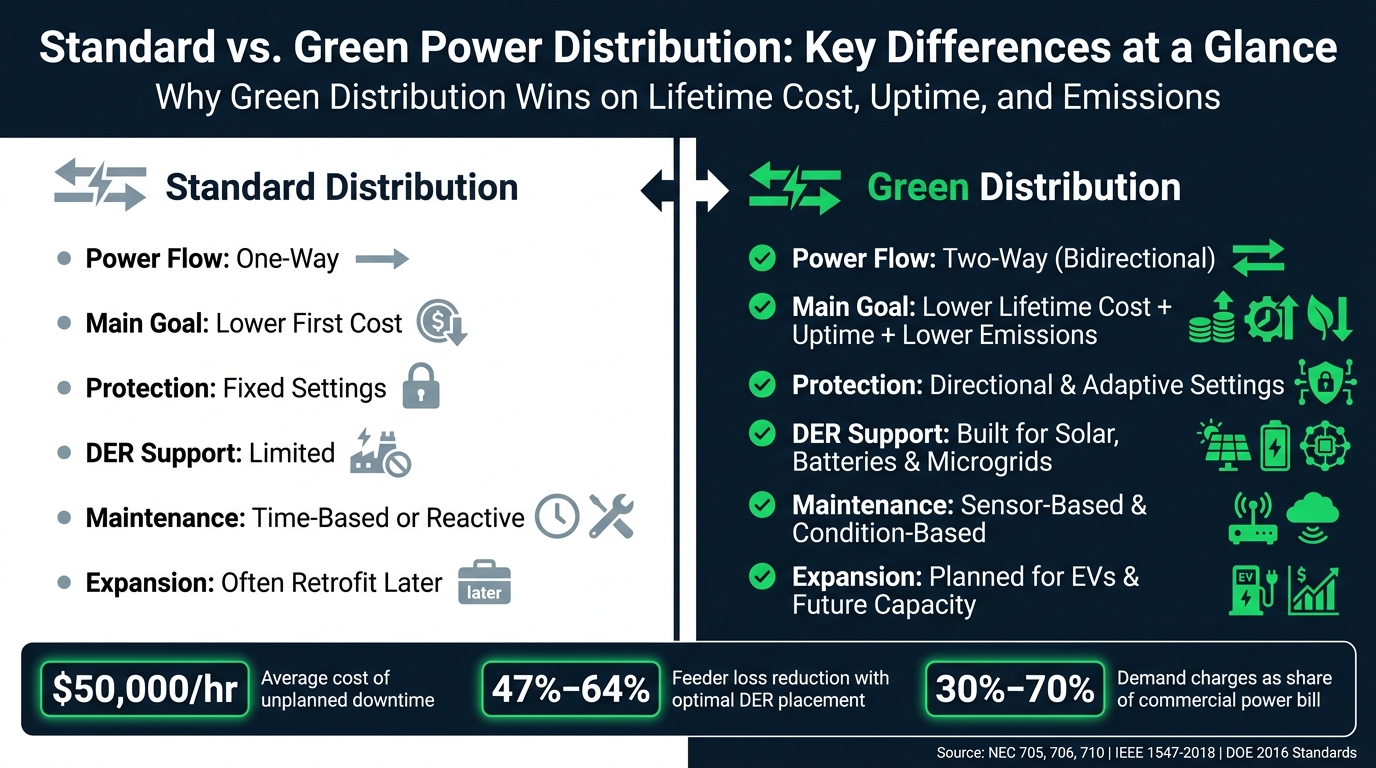
Standard vs. Green Power Distribution: Key Differences at a Glance
Quick Comparison
| Area | Standard setup | Green distribution setup |
|---|---|---|
| Power flow | One-way | Two-way |
| Main goal | Lower first cost | Lower lifetime cost, uptime, and lower emissions |
| Protection | Fixed settings | Directional and adaptive settings |
| DER support | Limited | Built for solar, batteries, and microgrids |
| Maintenance | Time-based or reactive | Sensor-based and condition-based |
| Expansion | Often retrofit later | Planned for EVs and future capacity |
If you’re planning a U.S. project, this guide is a clear roadmap for layout, equipment choice, code checks, commissioning, and long-term upkeep.
sbb-itb-501186b
System Design and Network Planning
Feeder Layout, Substations, Voltage Levels, and Load Forecasting
Once green distribution is defined, the next job is sizing the network for losses, resilience, and DER growth.
Start with the standard distribution hierarchy, then size each level for bidirectional flow and future load. Each layer - from the service entrance through feeders to branch circuits - needs to handle reverse power flow, resilience, and expansion from day one.
Voltage selection has an outsized effect on cost and performance. Distributing at 480V instead of 208V cuts current by about half at the same kW load. That means smaller conductors, lower resistive losses, and lower infrastructure cost. For most commercial and industrial facilities, 480Y/277V three-phase is the standard pick.
Load forecasting for green systems goes past a basic demand calculation. Engineers should review 12 to 24 months of 15-minute interval data to find the minimum daytime load - the point where PV can start backfeeding the feeder. That number sets the ceiling for how much PV you can add before reaching NEC 705.12 load-side busbar limits.
Here’s what that looks like in practice:
- An 800 A bus with an 800 A main breaker tops out at a 160 A PV breaker
- That limits the system to about 106 kW AC at 480V three-phase
If the solar design goes past that limit, a supply-side connection under NEC 705.11 - tapping conductors between the utility transformer and the main breaker - is usually the better path.
Before locking in feeder design, check available fault current. Always verify that the added fault contribution from inverters - typically 1.2× rated current - doesn’t push existing equipment past its interrupting rating.
Radial, Looped, or Meshed Distribution: How to Choose
The topology you choose affects almost everything: fault response, maintenance, and how well the system handles bidirectional DER power flow. Pick the right setup, and you usually get lower losses, fewer outages, and more room for DER hosting.
Radial is still the default for smaller, budget-conscious facilities because it’s simple and low-cost to install. The tradeoff is blunt: one upstream fault can take down the feeder. For larger commercial campuses or industrial sites, looped or meshed layouts provide redundant paths and better fault tolerance.
| Topology | Installation Complexity | Fault Tolerance | Losses | Best Fit |
|---|---|---|---|---|
| Radial | Low | Low (single point of failure) | Moderate | Residential, small retail |
| Looped | Moderate | High (normally open ties allow restoration) | Lower | Large commercial, campuses |
| Meshed | High | Highest (multiple paths) | Lowest | Industrial, mission-critical |
Topology also affects voltage stability, protection design, and how much DER a feeder can take on.
For many commercial projects, a smart middle path is to design feeders with normally open tie switches. That lets the system start as radial and later move to looped operation if resilience needs grow.
Distributed PV can also cut losses and voltage drop more effectively than one large PV block on the same feeder. For campuses and multi-building sites, that point matters more than it may seem at first glance.
Planning for Electrification and Future Capacity
EV charging adds a fast-growing load, and it can push transformers past nameplate capacity while speeding up insulation aging. Use transformer thermal modeling to measure life loss under EV charging duty.
Managed charging can delay - or sometimes avoid - an immediate transformer upgrade by shifting EV load away from peak demand windows. That keeps capacity planning focused on network growth instead of one spike from charging.
When upgrades can’t be avoided, cost becomes very real, very fast:
- Upgrading a 500 kVA transformer to 750 kVA usually costs $25,000 to $40,000
- Upgrading a 1,000 kVA transformer to 1,500 kVA usually costs $40,000 to $70,000
If more capacity is needed, modular switchgear and panelboards let you add it in phases instead of replacing the full distribution board. It also makes sense to oversize conduit and key raceways during initial construction. For single-phase EV charger installations, spread chargers across phases to limit voltage imbalance.
That capacity plan sets up solar, storage, and low-loss equipment selection.
Renewable Integration and Equipment Selection
Solar, Storage, and Distributed Energy Resources in the Distribution System
Once feeder capacity and growth paths are set, the next job is picking DER-ready equipment that keeps the system working the way it should.
Adding PV, storage, or other DERs changes power flow, fault current, and voltage control. In practice, DER hosting capacity comes down to four limits: thermal capacity, voltage regulation, busbar backfeed limits, and short-circuit rating. If even one of those gets pushed too far, you can end up with damaged equipment or protection that doesn't trip when it should.
One of the first things to check is voltage rise. Use this formula: Voltage rise % = (Reverse kVA ÷ Nameplate kVA) × Impedance %. IEEE 1547-2018 typically caps PV-driven voltage rise at 3%. That matters because a transformer with higher impedance hits that limit with less reverse flow.
There is some room to work with, though. If inverters are set up with the IEEE 1547-2018 default Volt-VAR curves, they can absorb reactive power as voltage increases. That can extend allowable PV capacity by 30% to 50% before any hardware upgrade is needed. In plain terms, that may buy time before a transformer upgrade becomes necessary.
Protection also needs to be reviewed once DERs are added. Grid-following inverters usually contribute about 1.2× rated current during faults. Since that fault contribution is lower than what many older protection schemes expect, standard overcurrent relays can under-reach or fail to operate as intended. That's the issue known as relay blinding. Before any DER addition is commissioned, confirm that the total fault current from the utility plus all inverters stays within the AIC rating of the existing switchgear.
Transformers, Switchgear, Breakers, and Low-Loss Components
Transformers play a big role in lifecycle losses across a green distribution system. For solar step-up transformers, use Dyn11 or YNd1 windings. The delta side blocks harmonics, while the grounded wye side supports protection.
For sizing, stick with this rule: transformer kVA ≥ 1.25 × inverter AC output. The DOE 2016 standard requires 98.9% efficiency at 50% load for transformers above 1,000 kVA. Over a 30-year life, an efficient 1,000 kVA unit can save more than $100,000 in energy costs compared with standard units.
Harmonics are another place where equipment choice matters. In areas with lots of electronic loads such as VFDs and inverters, specify K-13 or K-20 rated transformers. Standard units aren't built for the harmonic heating these loads create, and insulation degradation doubles for every 6°C above the design rated temperature. On the protection side, Zone Selective Interlocking (ZSI) helps trip only the faulted zone, which lowers arc-flash energy.
To manage power quality, use active harmonic filters and capacitor banks for power factor correction and harmonic control. IEEE 519 gives the working targets: keep voltage THD below 5% and current THD below 8% at the point of common coupling. Those limits set the baseline for the monitoring and maintenance work that comes next.
Sourcing New and Used Equipment Without Cutting Corners
Used or refurbished equipment can make sense, but only if the checks are solid. A bad rating or a hidden defect can wipe out the efficiency gains made earlier.
For used transformers, the first document to ask for is a recent oil dissolved-gas analysis (DGA) report. High hydrogen or furan levels can point to internal arcing or insulation breakdown that a visual check won't catch. For units more than 15 years old, that report isn't optional. It also helps to confirm the transformer's impedance value, because high-impedance units can increase voltage rise under reverse power flow and push a DER project out of IEEE 1547-2018 compliance before startup.
For used switchgear and breakers, check the AIC rating against the updated fault current study that includes DER contributions. A breaker that was fine before solar was added may no longer be enough once inverters are online. New equipment in 2026 currently carries lead times of 12 to 24 weeks, so well-documented surplus gear can be a good fit for tight schedules - as long as the condition and ratings hold up.
Electrical Trader lists new and used breakers, transformers, and low- to high-voltage equipment for replacement or expansion projects. Once the right gear is in place, attention turns to operating losses, reliability, and upkeep.
Sustainability Metrics, Operations, and Maintenance
Key Metrics: Losses, Reliability, Carbon Impact, and Maintainability
Once the system is energized, green performance has to be measured, not guessed. In U.S. projects, teams usually track results with IEEE 1366 reliability indices, especially SAIDI (System Average Interruption Duration Index) and SAIFI (System Average Interruption Frequency Index). Those numbers show how often customers lose power and how long outages last. That hits uptime and operating cost in a very direct way.
On the losses side, track real-power loss (kW) and reactive loss (kVAR) at the feeder level. When distributed generation is placed well and integrated the right way, total active power losses can drop by 47% to 64%. For carbon performance, track operational carbon intensity (kg CO₂e/kWh). That gives you the direct read on how much renewable displacement the system is actually delivering.
It also helps to keep an eye on THD, power factor, and utility-penalty exposure as part of routine compliance checks. When you compare system options, focus on the numbers that matter day to day: loss reduction, SAIDI/SAIFI, carbon intensity, and maintenance burden.
Preventive Maintenance and Condition Monitoring
Monitoring is what protects the efficiency gains built during design. Inverter-based generation adds thermal cycling, and that can shorten transformer life by 20% to 50%. So condition monitoring isn't just a nice extra. It's part of keeping the system from wearing out too soon.
The core monitoring stack includes online dissolved-gas analysis (DGA), partial discharge (PD) monitoring, online bushing monitoring - including imbalance current trends and top oil temperature - and infrared thermography on connections and switchgear. Each one ties back to something concrete: avoided failure, avoided downtime, or delayed replacement.
Beyond continuous monitoring, a few scheduled checks still do a lot of heavy lifting:
- Torque-verify all bolted connections on a set schedule
- Perform insulation resistance (megger) testing annually
- Confirm phase rotation during any recommissioning work
These checks don't cost much, but they help protect the efficiency gains built into the system design.
Protection Settings and Power Quality Control
As DER penetration and EV charging loads grow, static relay settings stop working well under bidirectional flow. Power isn't moving in just one direction anymore, and protection has to keep up. That means shifting to adaptive protection schemes that update settings as network conditions change.
For sites with changing load and reverse power flow, add directional overcurrent elements and negative-sequence functions to restore selectivity. Without that, protection can get messy fast.
On the power quality side, enable Volt/VAR and Volt/Watt modes on smart inverters under IEEE 1547-2018, and retune inverter controls when load or DER output changes. For EV charging clusters, use phase-aware scheduling and balance single-phase loads across phases to cut negative-sequence voltage unbalance.
Zone Selective Interlocking (ZSI) cuts incident energy by tripping only the faulted zone. After any breaker or DER change, verify ZSI settings so uptime and worker safety stay in sync.
Use these readings and settings as inputs to the rollout and optimization step that follows.
Implementation Workflow and Conclusion
Step-by-Step Rollout: From Assessment to Optimization
Once the design is set, the rollout needs to test the assumptions behind load, protection, and DER sizing in the field. In practice, a green distribution project usually moves through six steps.
It begins with site assessment and load analysis. Review 12–24 months of utility bills and interval data to set a baseline for load and storage value. Then move into modeling and DER sizing. Run a feeder-specific hosting capacity analysis to see how much DER the circuit can take before voltage or thermal limits are exceeded.
Next comes electrical design and protection. Lock in service voltage, interconnection drawings, and bidirectional protection before filing. It also helps to file utility applications early. Large C&I systems can run into long study timelines and P&C review.
Installation should follow a clear sequence: conduit and grounding, conductor pull, and torque-checked terminations. After that, commission the system with insulation resistance, phase rotation, anti-islanding, and full-load power-quality tests. Then install revenue-grade meters and record a baseline.
After the system is energized, use the first round of operating data to tune controls and confirm performance. Keep tracking harmonics, voltage sags, and demand peaks to support predictive maintenance.
Conclusion: Core Decisions That Shape a Green Distribution System
That workflow points to one rule: validate design choices in the field, then refine them with measured data.
Green power distribution works best when planning, equipment selection, commissioning, and monitoring all support bidirectional power flow and lower lifecycle losses. Choosing a ring or meshed configuration improves reliability, and that shows up over time in SAIDI and SAIFI performance. DER placement matters just as much. Optimal PV integration can cut active power losses by 47% to 65%.
K-rated transformers and low-loss components also shape the system’s efficiency ceiling and maintenance burden for years to come. Electrical Trader can help procurement teams source new and used breakers, transformers, and distribution equipment.
Green distribution is a lifecycle discipline. It has to balance upfront capital, long-term operating cost, regulatory compliance, and carbon performance at the same time. The teams that tie design, protection, monitoring, and maintenance into one plan are usually the ones most likely to meet reliability and sustainability targets as loads, generation, and grid conditions change.
FAQs
How do I know if my system can handle two-way power flow?
Run a power flow study to see how distributed energy resources change conditions across your network.
Transformers are bidirectional by design. They can carry their full nameplate kVA in either direction. The catch is simple: total RMS current still has to stay within the equipment’s thermal limit.
You’ll also want to check a few other things while you’re at it:
- Look for voltage rise
- Confirm protection settings are coordinated for bidirectional power flow
- Verify busbars comply with NEC 705.12
This is the part many teams gloss over. Power can move both ways, but that doesn’t mean every part of the system is automatically ready for it. A feeder might look fine on paper, then run into voltage or protection issues once DER exports start pushing upstream.
When should I choose load-side vs. supply-side interconnection?
Choose based on system size, equipment capacity, and safety requirements.
Load-side is often the lower-cost option for smaller systems that can use open capacity in an existing panelboard. The catch is that it’s limited by busbar ratings and the 120% rule. Supply-side gives you more room for larger systems when load-side space or capacity runs out, but it often means working with the utility and the AHJ and can lead to costly equipment changes.
What should I monitor after startup to avoid failures?
After startup, keep a close eye on system performance with power quality metering and analytics. This helps you catch problems early and gives your team the data needed for predictive maintenance before small issues turn into costly outages.
It also helps to track a few other areas on a regular basis:
- Load testing to check stability during peak demand
- Thermal scans to spot overheating before it leads to failure
- Equipment health, relay coordination, and protection settings to make sure the system is working as intended
- Records like as-built drawings and test reports, which make troubleshooting much easier when something goes wrong