

Pumped Hydro Storage Costs: What to Know
If you want the short answer: pumped hydro is expensive to build, slow to permit, and often worth it only when you need long-duration storage.
I’d boil it down like this:
- New pumped hydro projects often land around $5,000 to $6,000 per kW
- Most systems deliver about 10 to 20+ hours of storage, and some can run for multiple days
- U.S. pumped hydro totals about 22 GW, or roughly 96% of utility-scale storage
- Round-trip efficiency is usually about 75% to 85%
- Plant life can reach 80 to 100 years
- The biggest cost driver is usually civil works, often more than half of total CAPEX
- Remote sites can add big transmission and substation costs
- Compared with lithium-ion, pumped hydro tends to make more sense for longer discharge durations, not short 1-to-4-hour use cases
If I were reviewing a project, I wouldn’t stop at the sticker price. I’d look at site geology, tunnel and reservoir scope, interconnection distance, fixed O&M, pumping losses, and financing over decades. That’s where the project math changes.
Here’s the simple takeaway: pumped hydro is a long-life grid asset with high upfront cost and a narrow set of good use cases. It can help with bulk shifting, reserves, grid stability, and renewable curtailment, but only if the site and grid connection work in its favor.
That’s the lens I’d use for the rest of this topic.
How Studies Measure Pumped Hydro Storage Costs
CAPEX, O&M, and Storage Duration Metrics
PSH studies usually track the same core cost metrics: CAPEX, fixed O&M, variable O&M, LCOS, efficiency, and asset life.
Capital expenditure (CAPEX) is the upfront cost to build the plant. It's most often shown in $/kW of installed power capacity. Fixed O&M covers items like staffing and insurance, and it's reported in $/kW-year. Variable O&M includes pumping energy, water access, and network charges, and it's measured in $/MWh.
One thing that sets PSH apart is storage duration. These systems usually provide 10 to 20+ hours of discharge, which is much longer than most batteries. Some plants can even run for multiple days.
LCOS, Efficiency, and Asset Life
The levelized cost of storage (LCOS) takes total lifetime costs and divides them by the total energy discharged over the plant's operating life. For PSH, LCOS depends a lot on the carrying cost of capital because these projects cost a lot to build and then operate for a very long time.
Round-trip efficiency for PSH usually lands between 75% and 85%. In plain English, some energy is always lost during the pump-store-generate cycle. Asset life is another big part of the picture. PSH plants often operate for 80 to 100 years, which puts them in the category of long-lived grid infrastructure.
That long operating life can help spread the high upfront cost across many decades of service. For grid planners, that tradeoff matters a lot. The lifecycle assumptions behind LCOS, efficiency, and plant life set up the cost drivers discussed next.
Typical Cost Ranges From Recent Studies
Recent estimates for large new PSH projects tend to cluster around $5,000 to $6,000/kW in real terms. High-profile projects under development in Australia, including Snowy 2.0 and Borumba, sit in that same range.
Project design has a big effect on where costs land. Greenfield projects with tunnels, new reservoirs, and access roads usually end up near the high end. Studies based on existing reservoirs will often show lower numbers. That's why it's worth checking the assumptions before treating any published figure as a benchmark.
The next section gets into why site conditions and project design can push PSH costs up or down.
sbb-itb-501186b
What Drives Pumped Hydro Project Costs
Recent studies point to three main forces behind pumped storage hydropower, or PSH, costs: site conditions, equipment choices, and grid access.
Civil Works, Equipment, and Interconnection
Civil works are usually the biggest cost category in PSH projects, often making up more than 50% of total CAPEX. That includes reservoir construction, tunneling, and underground excavation. And this is where projects can start to look very different from one another. A site with tough geology or difficult terrain can get expensive fast.
Electromechanical equipment is another big cost bucket. This covers the core powerhouse systems, including turbines, pumps, generators, transformers, switchgear, and control systems. Costs here depend a lot on the turbine-pump setup and the head - the vertical drop between reservoirs.
Grid interconnection can also push costs up in a big way. Many of the best PSH sites have what developers want on paper: large elevation differences and suitable geology. But those same sites can be far from existing transmission. That means longer transmission lines and, in many cases, substation upgrades.
After CAPEX, the next piece is how the project performs over time. That’s where operating assumptions start to matter.
Operating Costs and Performance Assumptions
Beyond construction, O&M and efficiency shape long-run economics. O&M is small next to CAPEX, but over a multi-decade asset life, it adds up.
Fixed O&M covers labor and routine maintenance for rotating and electromechanical equipment. Variable O&M includes water handling and pumping-related grid charges.
At about 80% round-trip efficiency, PSH loses roughly 20% of stored energy, which has a direct effect on lifecycle cost.
Permitting and regulatory timelines add soft costs too. Environmental review, water rights, and approval processes can stretch schedules and increase carrying costs.
Cost Drivers Comparison Table
| Cost Driver | Typical Share of Total Cost | What Affects It Most | Impact on Project Economics |
|---|---|---|---|
| Civil Works | Often >50% of CAPEX | Site geology, reservoir design, tunneling depth | Highest variability; drives site-to-site cost differences |
| Electromechanical Equipment | Significant CAPEX share | Turbine/pump type, head, generator capacity | Affects efficiency and operating performance |
| Grid Interconnection | Variable | Distance to existing transmission, substation upgrades needed | Major cost driver for remote but geographically ideal sites |
| Permitting & Soft Costs | Long permitting timelines | Environmental regulations, water-use rights, review timelines | Raises schedule risk and financing cost |
| Fixed & Variable O&M | Low annually, significant over asset life | Labor, water handling, rotating equipment maintenance | Small annually, large over decades |
What Research Shows About PSH Economics in Smart Grids
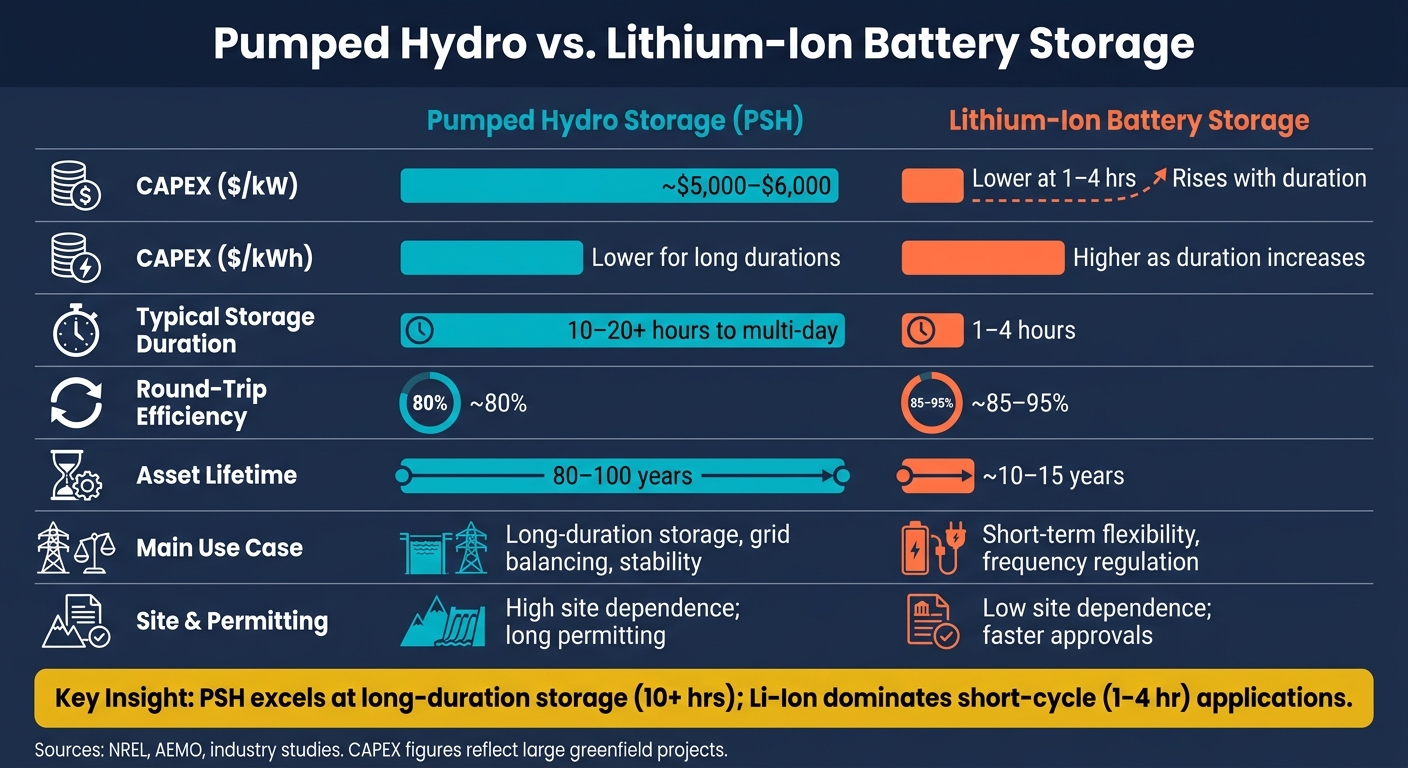
Pumped Hydro vs. Lithium-Ion Battery Storage: Cost & Performance Comparison
Grid Services That Add Project Value
Once you know the capital cost, the next step is simple: can PSH make enough money from grid services to pay for itself?
That answer goes well beyond plain energy shifting. PSH can support balancing services, frequency regulation, reserve services, capacity adequacy, black-start capability, voltage support, and grid firming. It can also move renewable generation from one time period to another and cut curtailment. The catch is that service value changes based on market rules and how those services are bought.
Research tends to draw a clear line between batteries and PSH. Batteries fit fast, short-duration work. PSH fits long-duration balancing. In practice, that means PSH still stands out for multi-hour and multi-day balancing, and that stack of grid services is what helps support project economics and LCOS viability. Studies also note that when pumped hydro is underbuilt, grids can end up with more renewable curtailment and heavier use of gas turbines.
PSH vs. Other Grid-Scale Storage: Cost Comparison Table
The gap between PSH and batteries helps explain why PSH is usually viewed as a system-level investment, not a single-point fix. The table below shows the main cost and operating tradeoffs.
| Feature | Pumped Hydro Storage (PSH) | Lithium-Ion Batteries |
|---|---|---|
| CAPEX ($/kW) | ~$5,000–$6,000 | Lower at 1–4 hours; rises as duration increases |
| CAPEX ($/kWh) | Lower for long durations | Higher as duration increases |
| Typical Duration | Tens of hours to multi-day cycles | 1 to 4 hours |
| Round-Trip Efficiency | ~80% | ~85%–95% |
| Asset Lifetime | Several decades | ~10–15 years |
| Main Use Case | Long-duration storage, system balancing, grid stability | Short-term flexibility, frequency regulation |
| Site Constraints & Permitting | High site dependence; long permitting due to environmental review and water rights | Low site dependence; faster approvals |
Those economics flow straight into planning for substations, transformers, switchgear, and interconnection.
Practical Takeaways for U.S. Grid Upgrades and Equipment Planning
How PSH Findings Affect Substation and Distribution Equipment Decisions
PSH doesn’t just switch on and sit there. It moves back and forth between pumping and generating, and that operating pattern has a direct effect on the gear around it.
That means the value of a PSH project depends on more than the plant itself. It also depends on the substation and interconnection equipment that links the facility to the grid. Fast pump-generate cycling can change equipment specs at those connection points. And because civil works and interconnection already make up a big share of project CAPEX, grid-connection hardware belongs in the cost picture from day one, not as a later add-on.
Transformers, breakers, and SCADA systems need to support bi-directional power flow and frequent mode shifts. Controls and governors matter just as much. Recent hydro orders for reversible units and frequency-regulating controls make that plain: PSH buying decisions now reach well beyond the powerhouse itself. Interconnection hardware and control systems are core procurement items, and each one has to match the operating profile that gives PSH its grid role.
Where Electrical Trader Fits Into Supporting Infrastructure Needs
Those grid upgrades often call for fast access to replacement parts and standard distribution equipment. Electrical Trader can help with PSH-related upgrades by supplying breakers, transformers, and other power distribution equipment for support systems and replacement needs.
Conclusion: Key Cost Points to Keep in View
With that equipment picture in view, the cost issue comes back to lifecycle value.
PSH comes with high upfront capital costs. Recent high-profile projects come in at about $5,000 to $6,000 per kW. But these assets can operate for decades, which spreads CAPEX over a long service life and changes the math in a big way.
The system-level upside is hard to ignore:
- Every gigawatt of long-duration storage deployed can cut variable operating costs by as much as $286.5 million per year.
- Each MW of installed LDES can avoid the curtailment of 2.5 MWh to 3.5 MWh of variable renewable energy generation.
That’s why study-based cost review matters more than rule-of-thumb estimates when teams start locking in equipment specs, interconnection designs, and procurement budgets.
FAQs
When does pumped hydro make financial sense?
Pumped hydro can make financial sense as a long-duration flexibility asset, especially as grids add more wind and solar that don’t produce power at the same level all day.
Here’s the basic idea: operators use electricity when demand is low, or when prices dip to zero or below, to pump water uphill. Then they release that water to make power when demand - and prices - are higher. Buy low, sell high. That’s the core of the model.
The economics can also look better because pumped hydro does more than shift energy from one time of day to another. It can help with:
- grid balancing
- frequency regulation
- capacity needs
Yes, the upfront cost is high. But these projects also tend to last a long time, and they can store energy for many hours or even multiple days. That gives them an edge when the grid faces larger imbalances that shorter-duration storage may struggle to cover.
Why do pumped hydro project costs vary so much?
Pumped hydro project costs can swing a lot from one project to the next. The big reason is simple: these systems need a heavy upfront spend. In many cases, costs land around $2 million to $5 million per MW, and the final price depends a lot on the site and how the project is set up.
A few factors tend to drive most of that cost:
- Geography and elevation needs: The land has to work for the system. If the site needs more digging, more tunneling, or more complex civil work, costs climb fast.
- Permitting, environmental review, and water rights: These steps can take time and money, and they often shape both the budget and the project timeline.
- Whether the project is new construction or a retrofit: Building from scratch usually costs more than reworking an existing site, though that depends on what infrastructure is already there.
- Financing structure and cost of capital: How the project is funded matters a lot. Even a solid project can get much more expensive if financing terms are tough.
How does pumped hydro compare with batteries for long-duration storage?
Pumped hydro and batteries do different jobs on modern power grids, and that’s exactly why both matter.
Batteries are usually the go-to choice for short-term flexibility, fast power regulation, and ancillary services. They respond fast, which makes them a good fit when the grid needs help right away.
Pumped hydro, on the other hand, is still the standard for long-duration storage. Batteries usually provide about two to six hours of capacity. Pumped hydro can store energy for tens of hours, and in some cases even multiple days.
The tradeoff is pretty simple: pumped hydro can deliver much longer storage, but it usually comes with higher upfront costs and longer development timelines.