IoT in Predictive Maintenance for HV Systems
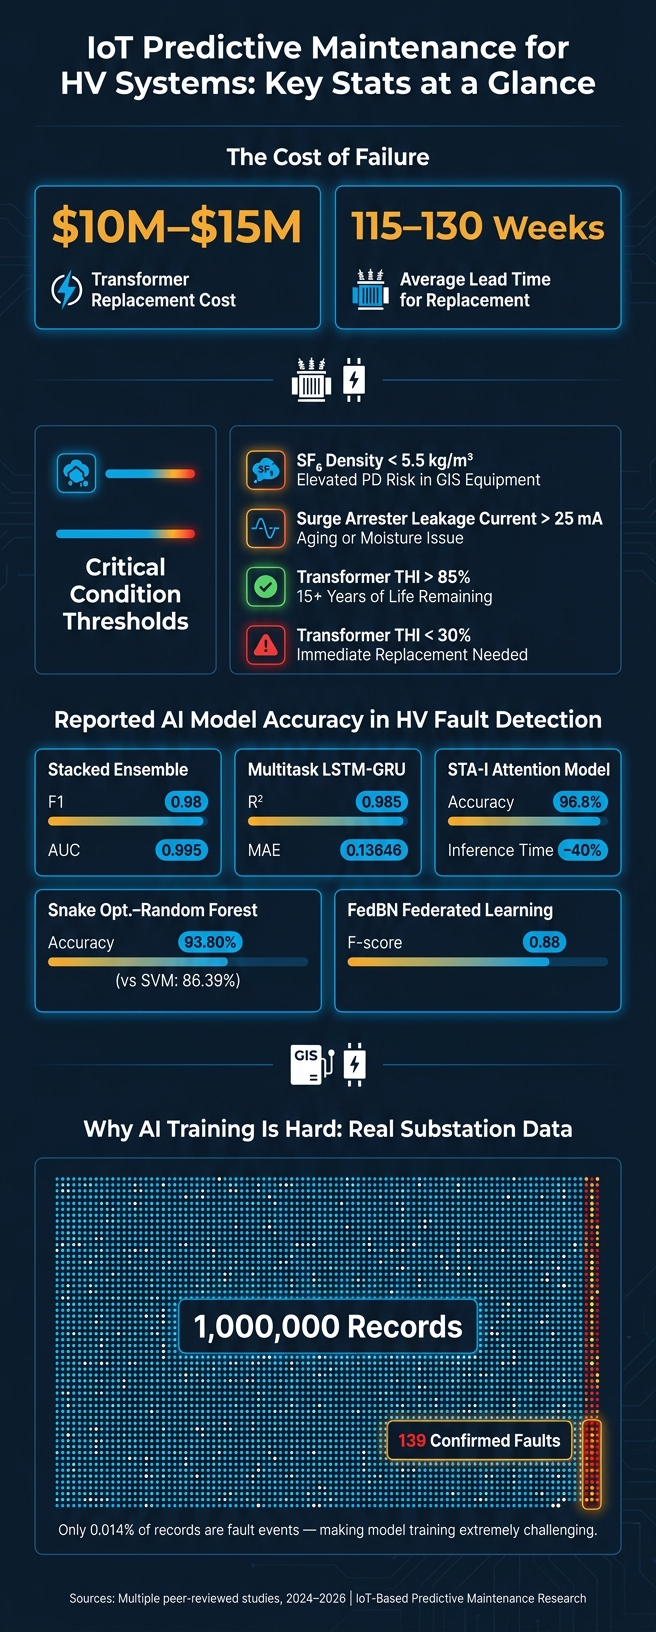
_If a high-voltage transformer fails, you may be looking at a replacement cost of _$10 million to $15 million_ and a wait of 115 to 130 weeks._* That’s why I’d sum up this topic in one line: IoT helps utilities spot trouble earlier, plan maintenance based on asset condition, and lower the risk of surprise outages.
Instead of servicing HV equipment on a fixed calendar, utilities now use sensor data from transformers, breakers, GIS, cables, and bushings to watch for early warning signs. The research in this article shows a clear pattern: the best-studied assets are transformers and switchgear, the main inputs are gas, temperature, pressure, vibration, and partial discharge data, and AI models can classify faults with high accuracy when the data is clean and time-aligned.
If I had to boil the full article down, here’s what matters most:
- Time-based maintenance has limits. It can miss faults that develop between service intervals.
- IoT-based monitoring uses live condition data such as DGA gases, winding temperature, SF₆ density, leakage current, and PD signals.
- Transformers get the most research attention because failure costs are high and lead times are long.
- Common architecture includes field sensors, IEDs/RTUs, edge gateways, standard protocols like IEC 61850 and OPC UA, plus cloud or digital-twin analytics.
- AI methods used in studies include stacked ensembles, LSTM-GRU models, attention models, federated learning, and unsupervised anomaly tests.
- Reported model results are strong in several studies, including F1 = 0.98, AUC = 0.995, R² = 0.985, and 93.80% fault diagnosis accuracy in a June 2026 transformer study.
- There are still limits: class imbalance, sensor drift, cyber risk, legacy OT systems, and slow SCADA cycles can reduce model performance.
- Early warning only helps if replacement equipment can be sourced in time.
A few numbers stand out:
- SF₆ density below 5.5 kg/m³ is linked to higher PD risk in GIS equipment.
- Surge arrester leakage current above 25 mA can point to aging or moisture issues.
- In one substation case, 1,000,000 records produced only 139 confirmed faults, which shows how hard fault-model training can be.
- A transformer THI above 85% suggests more than 15 years of life left, while below 30% points to replacement.
Bottom line: I see this research saying that IoT-based predictive maintenance is less about fancy software and more about using the right sensor data, moving it through a clean data pipeline, and acting before a fault turns into an outage.
That’s the core of the article below.
IoT Predictive Maintenance for HV Systems: Key Stats & AI Model Performance
Siemens' IoT Solution: Predictive Asset Management for Maintenance of Switchgears
sbb-itb-501186b
2. Sensor Technologies and Condition Data Studied in HV Assets
Recent studies look at multiple sensor streams at the same time across transformers, breakers, switchgear, cables, and bushings. The exact signals change by asset type. Transformers get the most attention because they show several failure modes that can be measured directly.
2.1 Transformer Monitoring: DGA, Temperature, Moisture, Vibration, and Partial Discharge
For power transformers, dissolved gas analysis (DGA) is one of the main diagnostic tools. These sensors measure gases in transformer oil, including hydrogen (H₂), methane (CH₄), acetylene (C₂H₂), and carbon monoxide (CO). High C₂H₂ is linked to arcing, while a rise in CO points to aging in cellulose insulation.
Temperature monitoring is also widely used. Resistance temperature detectors (RTDs) and fiber optic sensors track oil temperature and winding hot-spot temperature in °C or °F. If readings move out of range, that can signal overloading or trouble in the cooling system.
Another method gaining traction is online Frequency Response Analysis (OnFRA). These systems scan from 100 Hz to 10 MHz and measure transfer impedance to spot mechanical movement inside the transformer, such as winding deformation or coil loosening. A 2025 study combined OnFRA, DGA, thermal, and bushing data inside SCADA to detect inter-turn shorts and bushing delamination.
For bushings, capacitive tap sensors track capacitance (C_p) and dissipation factor (tan δ). A shift in either reading can signal dielectric degradation or moisture ingress.
2.2 Circuit Breakers, Switchgear, Cables, and Bushings
SF₆-insulated equipment, such as circuit breakers and gas-insulated switchgear (GIS), depends heavily on gas density and pressure monitoring. Density relays and pressure transducers measure SF₆ levels in kg/m³ and MPa. When density drops below 5.5 kg/m³, insulation strength falls and partial discharge increases. In one study, PD frequency climbed from 0 to 5–10 occurrences per day, while discharge magnitude moved from tens to hundreds of picocoulombs (pC). Switching can push SF₆ pressure up to 0.960 MPa.
For surge arresters, the main signal is leakage current, measured in milliamps (mA) with core-through current transformers. A rise in resistive leakage current, especially above 25 mA, points to aging zinc oxide valve discs or internal moisture. In a 2025 study on ultra-high-voltage GIS equipment, leakage current peaked at 95.591 mA under 40% voltage escalation because of thermal effects on the valve discs.
Cables are often monitored through partial discharge detection with high-frequency current transformers (HFCTs) or ultra-high frequency (UHF) antennas. PD activity is measured in pC or mV and helps identify insulation voids, delamination, and treeing.
The most common sensor-to-fault links are shown below:
| Asset Type | Sensor Type | Measured Parameter | Common Units | Likely Fault Detected |
|---|---|---|---|---|
| Transformer | DGA Sensor | H₂, CH₄, C₂H₂, CO | ppm | Arcing, overheating, insulation aging |
| Transformer | RTD / Fiber Optic | Oil & Winding Hot-Spot Temperature | °C / °F | Overloading, cooling system failure |
| Transformer | OnFRA Module | Transfer Impedance (Z) | Ω, Phase (°) | Winding deformation, inter-turn short circuits |
| Bushing | Capacitive Tap Sensor | Capacitance (C_p) & tan δ | pF, % | Dielectric degradation, moisture ingress |
| GIS / Circuit Breaker | Gas Density Relay | SF₆ Gas Density | kg/m³ | Gas leakage, insulation strength loss |
| GIS / Circuit Breaker | Pressure Transducer | SF₆ Gas Pressure | MPa | Leakage, insufficient gas replenishment |
| Switchgear | Infrared / UV Sensor | Terminal Temperature / UV Intensity | °C / °F, nm | Loose contacts, corona discharge, flashover |
| Circuit Breaker | Coil Current / Operating Time | A, ms | Mechanical wear, contact degradation, or delayed operation | |
| Surge Arrester | Current Transformer | Leakage Current | mA | Valve disc aging, internal moisture |
| Cables | HFCT / UHF Antenna | Partial Discharge (PD) | pC, mV | Insulation voids, delamination, treeing |
Environmental inputs like ambient temperature, humidity, and vibration are not treated as background noise. They are part of the condition picture. For example, moisture changes a surge arrester’s resistive leakage current, so humidity needs to be part of the model. These sensor streams matter only if the data can be transmitted and analyzed in a dependable way.
3. IoT Architectures and AI Models Used in Predictive Maintenance Studies
Recent studies break HV IoT predictive maintenance into four parts: sensing, data transport, analytics, and maintenance action.
3.1 Common Architecture: Sensors, Edge Gateways, Communications, and Cloud Analytics
Most studies map the pipeline the same way. Field sensors, RTUs, and intelligent electronic devices (IEDs) collect condition data from the asset. That data then moves through edge gateways, where systems handle timestamp alignment, noise filtering, and quality tagging before transmission. A digital twin mirrors the asset’s state, tests maintenance scenarios, and can trigger prioritized work orders for human approval.
One sticking point keeps showing up: interoperability. That’s a big deal in substations with gear from different vendors. Studies most often point to IEC 61850, CIM, and OPC UA for interoperability and secure data exchange, including time-critical traffic.
A solid field example comes from the Badra Oil Field SS1 substation in Iraq. Researchers tested a digital-twin-enabled predictive maintenance framework on two 33/11.5 kV step-down transformers. The system handled about 1 million multivariate time-stamped records and 139 confirmed fault events, while integrating IEC 61850 and OPC UA. The main lesson is pretty practical: a large, time-aligned dataset can move through standard industrial protocols and feed an operating monitoring loop.
These architectures only matter if they lead to better fault detection and better maintenance timing.
3.2 Machine Learning, Anomaly Detection, and Digital Twins
Once the pipeline is in place, the focus shifts to the models. The job here is simple to state and hard to do well: turn sensor streams into maintenance signals people can act on.
Digital twins now support live fault reconstruction and diagnosis. When labeled failure data is limited, unsupervised statistical tests like Chi-Square and Kolmogorov-Smirnov can run on embedded edge devices to flag anomalies in partial discharge patterns without needing a prior fault database. That matters because many utilities don’t have a deep archive of labeled failures just sitting around.
Federated Learning takes a different route. It lets multiple utilities train a shared model without sharing raw operating records, so substation data stays local. Among the methods covered, FedBN appears to perform best when data varies from one utility to another, posting an F-score of 0.88.
The table below sums up the main AI and machine learning methods used in recent HV predictive maintenance research:
| AI/ML Method | Input Data | Primary Output | Reported Performance |
|---|---|---|---|
| Stacked Ensemble | SCADA (voltage, current, temperature, DGA) | Fault class / risk alert | F1: 0.98; AUC: 0.995 |
| Multitask LSTM-GRU | DGA, oil quality, furan, electrical tests | Health index + life expectancy | R²: 0.985; MAE: 0.13646 |
| STA-I (Attention) | Oil temperature, DGA (7 gases), vibration | Fault prediction | Accuracy: 96.8%; inference time reduced by 40% |
| ANFIS-OCT Hybrid | Thermal-electric field, PD, insulation data | Fault recognition | 93.4% recognition rate; 2.3% drop at 30% noise |
| FedBN (Federated) | Breaker/transformer sensors (multi-utility) | Predictive maintenance | F-score: 0.88 |
| Chi-Square / KS Test | Partial discharge patterns | Anomaly alert | Real-time unsupervised detection on embedded devices |
The next issue is whether these model gains still hold up in live deployments and across full fleets.
4. Reliability Results, Cost Impact, and Deployment Trends
4.1 Reported Reliability Gains and Failure Reduction
Recent studies show that IoT-based condition monitoring finds HV faults earlier and with more precision than fixed-interval maintenance. That matters because the data is continuous, not based on one-off inspections.
For transformers, Transformer Health Index (THI) scores above 85% point to more than 15 years of life left. Scores below 30% mean immediate replacement is needed. Since these scores come from live condition data, teams can use them inside a predictive maintenance loop instead of treating them like a static checkup.
A June 2026 study pushed this further. It used a digital twin-assisted Snake Optimization–Random Forest model with five dissolved gases to diagnose internal transformer faults. The model reached 93.80% accuracy, compared with 86.39% for SVM and 89.98% for Random Forest.
GIS equipment shows a similar pattern. When SF₆ density drops below 5.5 kg/m³, PD risk jumps, and partial discharge frequency climbs from 0–1 to 5–10 occurrences per day. In plain terms, that kind of shift can turn a quiet asset into a problem child fast.
These gains matter most when they cut outage risk and push back major replacement work.
4.2 Cost, Downtime, and Fleet Management Findings
Accuracy alone doesn’t pay the bills. The value shows up when utilities avoid downtime and skip emergency replacement.
Large transformers usually cost $10 million to $15 million to replace, and lead times run about 115 to 130 weeks. If one fails and there’s no in-service spare, a site can be offline for months. IoT-based monitoring gives owners time to plan, line up equipment, and replace assets on schedule instead of scrambling in crisis mode.
Here are the operational outcomes that stand out most across key asset types:
| Asset Type | Monitoring Approach | Operational Impact |
|---|---|---|
| Power Transformer | THI & Multitask LSTM-GRU | Continuous health scoring enables planned replacement before failure |
| HV Circuit Breaker | Federated Learning (FedBN) | Fault prediction across multi-utility fleets without sharing raw data |
| HV Bushings | Capacitive Tap (FRACTIVE® 4.0) | Early-stage delamination detected without service interruption |
There’s still a gap between research results and broad commercial use across U.S. utilities. So even when predictive maintenance spots a failing asset early, the next bottleneck is simple: how fast can that asset be replaced?
4.3 Sourcing Considerations for IoT-Ready HV Equipment
Predictive maintenance works best when replacement equipment can be sourced fast enough to match the warning window. Otherwise, an early alert is just bad news delivered sooner.
Assets with built-in IEC 61850 and OPC UA support fit well with modern predictive maintenance layers. For older infrastructure, modular add-ons such as OnFRA® 4.0 and FRACTIVE® 4.0 can be installed on existing transformer bodies and bushing taps without service interruption.
When THI or fault models point to replacement, speed becomes the main issue. Electrical Trader offers new and used transformers and breakers for faster replacement sourcing.
5. Limits, Cybersecurity, and Key Takeaways
5.1 Data Quality, Scalability, and Cybersecurity Gaps
These gains hinge on two things: clean data and secure integration. If either one slips, performance does too. Sensor drift, aging hardware, and environmental noise can all chip away at measurement accuracy. A simple issue, like dust on an IR sensor, can throw off readings. That’s why calibration and testing still matter a lot.
Model training has another problem, and it’s a big one: faults don’t happen often. That may sound like good news for grid operations, but it makes AI training much harder. In the SS1 substation study, 1,000,000 records produced only 139 confirmed faults. With data that lopsided, models can struggle to spot the rare events that matter most. Teams often deal with this by using stacked ensemble models or by generating synthetic fault data with GANs.
Moving from a pilot to utility-wide rollout brings its own headaches. The same setup covered in Sections 3 and 4 - sensors, edge gateways, and cloud analytics - has to work inside day-to-day utility conditions. In practice, 60-second SCADA cycles, legacy OT integration, and human approval steps can slow things down. On top of that, connecting HV assets to IP networks opens the door to more cyber risk. The standards cited most often are IEC 62443 for defense-in-depth zoning and NERC CIP-015-1 for internal network security monitoring.
| Challenge Category | Example Issue | Common Mitigation Approach |
|---|---|---|
| Data Quality | Sensor drift and environmental noise (e.g., dust on IR sensors) | Edge filtering, regular calibration, and multi-source data fusion |
| Model Accuracy | Extreme class imbalance (139 faults in 1,000,000 records) | Stacked ensemble models and synthetic data generation using GANs |
| Scaling | 60-second SCADA supervisory cycle latency | Edge-AI for local feature extraction and physics-inspired proxies |
| Cybersecurity | Unauthorized access to substation OT infrastructure | IEC 62443 zoning, encryption, and NERC CIP-015-1 monitoring |
| Interoperability | Mixed vendor protocols | Standardized data mapping |
5.2 Conclusion: What the Research Most Clearly Shows
Across the studies, the strongest results show up in transformer and switchgear monitoring. IoT systems give teams a much closer view of asset condition, especially in the gaps between fixed inspection cycles. That matters because plenty can change between service windows.
AI can sharpen early warning, but there’s a catch: it works best when the input data is strong. In the Badra Oil Field digital-twin model, substation validation reached an F1-score of 0.98 and an AUC of 0.995. Those numbers are hard to ignore.
At the ground level, the payoff is pretty simple. Better health scoring and fault detection help crews act before failure hits. Instead of scrambling after an outage, teams get a chance to schedule maintenance at the right time and avoid some of the disruption in the first place.
FAQs
How does IoT improve HV maintenance?
IoT changes high-voltage maintenance from a fix-it-after-it-breaks job into a data-led, ahead-of-time approach.
Here’s how it works: sensors installed on assets like transformers and circuit breakers track real-time conditions, including temperature, vibration, pressure, and electrical signals.
AI and machine learning then review that data to spot unusual patterns, flag faults early, and estimate the remaining useful life of equipment.
The payoff is straightforward. Teams can cut downtime, improve grid reliability, and lower maintenance costs. Instead of reacting when something fails, they can step in before small issues turn into expensive outages.
Which HV assets benefit most from predictive monitoring?
The HV assets that gain the most from predictive monitoring are:
- Power transformers
- High-voltage circuit breakers (HVCBs)
- Surge arresters
These components sit at the heart of power transmission and substation stability. If one starts to fail, the ripple effect can be costly and hard to ignore.
That’s why utilities use IoT sensors and AI models to keep a close watch on key signals, including vibration, coil current, gas concentration, temperature, pressure, and leakage current.
What limits AI accuracy in HV fault detection?
AI accuracy in high-voltage fault detection can be held back by a few common issues:
- Imbalanced fault samples, especially when rare fault events show up far less often than normal cases
- Weak feature representation and hyperparameter settings, which can make patterns harder for the model to learn
- Sample distribution problems and overlapping gas patterns, where different fault types look too similar in the data
- Data acquisition lag, weak multi-source data fusion, and sensor noise, all of which can blur the signal the model needs to read
Put simply, the model is only as good as the data and setup behind it. If rare faults barely appear in training data, sensors add noise, or gas signatures start to blend together, accuracy can drop fast.