Load Profiling for UPS Sizing: Key Considerations
Most UPS sizing errors start with one bad step: using nameplate ratings instead of measured load.
I’d sum it up like this: if you size a UPS from labels alone, you can end up paying too much for a unit that runs at a poor load level, or pick one that fails during peaks, inrush, or uneven phase loading. A better approach is to build the UPS around measured kW, kVA, power factor, runtime, phase balance, startup current, and future headroom.
Here’s the short version:
- Nameplate ratings often overstate demand by 30% to 50%
- Many devices run at only 50% to 70% of labeled load
- Motors and compressors may pull 15x to 20x normal current at startup
- UPS units often run best at 60% to 80% of rated load
- Battery plans should match the actual bridge time, whether that’s 10–20 minutes or several hours
- Three-phase systems can still overload on one leg even when total load looks low
- Battery life drops fast in heat; for VRLA, every 18°F above 77°F can cut life by about half
What I’d look at first:
- Which loads must stay on, and which can drop
- What the site draws over time, not just what’s installed
- Whether loads restart one by one or all at once
- Whether the room, floor, bypass path, and voltage setup fit the UPS
That’s the core idea: build the UPS around how the site actually uses power, not around worst-case labels.
UPS and Battery size calculation | UPS Redundancy
sbb-itb-501186b
What to Include in a UPS Load Profile
A load profile shows what your UPS actually has to support over time: kW, kVA, power factor, and operating schedule for each backed-up circuit or panel. In plain English, it shows the highs, the dips, and the times when several loads hit at once.
That matters because connected load and actual demand are not the same thing. Once you map both, you can sort loads by how critical they are and how they behave during the day.
Separate Critical, Essential, and Noncritical Loads
Not every device needs the same backup plan. Treating every load as equally important is one of the fastest ways to oversize a UPS.
| Classification | What It Means | Typical Equipment |
|---|---|---|
| Critical | Must stay on without interruption | Servers, PLCs, HMIs, emergency communications |
| Essential | Needs a few minutes for orderly shutdown | Storage arrays, networked workstations |
| Noncritical | Can drop immediately on utility loss | Office equipment, non-emergency lighting |
Leave noncritical loads out of the backup calculation. If you include them, the kVA requirement goes up, and you can end up with a larger unit that runs less efficiently.
Capture Demand, Power Factor, and Load Timing
For each circuit, record real power (kW), apparent power (kVA), and power factor. For example, a 10 kVA load at 0.8 PF delivers 8 kW, but the UPS still has to supply the full 10 kVA.
Power factor changes UPS sizing more than many teams expect. Many modern UPS systems run at unity power factor, or PF = 1.0, so kVA equals kW. Older units rated at 0.8 PF deliver 20% less real power for the same kVA rating. If the UPS spec and the load’s power factor profile don’t line up, you can run short on capacity and not see it coming.
Peak demand also comes from coincident load, not just connected load. A plant with two staggered shifts may have a much lower peak than one where everything starts at the same time. Same gear, very different demand picture.
Account for Nonlinear and Motor Loads
Next, look at load behavior that changes what the UPS can handle in the field.
Switch-mode IT loads add harmonics and high crest factor, which can reduce usable UPS capacity by 20% to 35%. So even if the nameplate looks fine, a UPS under a heavy IT load may have less working capacity than expected.
Motors, compressors, and transformers cause a different issue: inrush current. At startup, these loads can pull 6 to 20 times their steady-state current. Start large transformers or PDUs on bypass, then return them to UPS operation after steady state.
Legacy transformer-based UPS systems also derate more under leading power factor loads. Transformerless units are less affected.
Keep IT loads and motor loads separate in the profile. They push UPS capacity and battery sizing in different ways, and they shape the phase, voltage, and runtime checks that come next.
Sizing Factors That Are Commonly Missed
Once the load profile is built, do the last checks that often decide whether the UPS will hold up in the field.
Phase Configuration and Load Balance
With a three-phase UPS, single-phase loads need to be spread across L1, L2, and L3. Why? Because each phase can only handle one-third of the unit’s total capacity.
Take a 100 kVA UPS. On paper, that means about 33.3 kVA per phase. So if Phase B ends up with 35 kVA while the other two phases carry just 2.5 kVA each, the UPS can flag an overload even though the total load is only 40 kVA.
That’s where teams get tripped up. Single-phase IT gear often gets added bit by bit, and if no one tracks which phase it lands on, one leg can get overloaded fast.
Aim to keep phase loads within 10% of one another, and check neutral and grounding needs before making the final selection.
Runtime Target and Battery Autonomy
After phase balance, the next step is simple: make sure the battery can cover the actual operating window.
A lot of runtime planning goes wrong because it assumes full load across the board instead of using the load profile you already built. The better starting point is this: what does the battery need to bridge? A short gap while a generator starts? Or a longer stretch for shutdown or continued operation?
| Scenario | Target Runtime |
|---|---|
| Generator-supported facility | 10–20 minutes (covers start + transfer) |
| No generator (graceful shutdown) | 20–30 minutes |
| Extended ride-through | 60–120 minutes |
| Remote/edge sites | 4–8 hours |
If a generator is part of the plan, size battery runtime for the full start-and-transfer sequence, not just the listed transfer time. And give yourself some breathing room: add a 10%–20% battery-capacity margin to account for aging.
Growth Margin, Ambient Temperature, and Installation Limits
Once runtime is set, make sure the UPS still fits the site and leaves room for future load.
A common target is to commission the UPS at 60%–70% of rated capacity, which leaves 30%–40% headroom for growth. That buffer matters. A system that looks fine on day one can feel tight much sooner than expected.
Temperature also plays a big part in battery life. For VRLA batteries, every 18°F increase above 77°F cuts service life by about half. That’s a tough penalty. If the UPS room runs warm, use the manufacturer’s temperature curves to derate battery performance instead of assuming normal office conditions.
Then there’s the physical side, which people sometimes leave until late in the process. Check the floor load rating. Keep the OEM-required 6–24 inches of clearance. And make sure there’s a maintenance bypass path in the layout.
A Practical Process for Building a Load Profile and Choosing UPS Capacity
UPS Load Profiling: 3-Step Sizing Process with Key Metrics
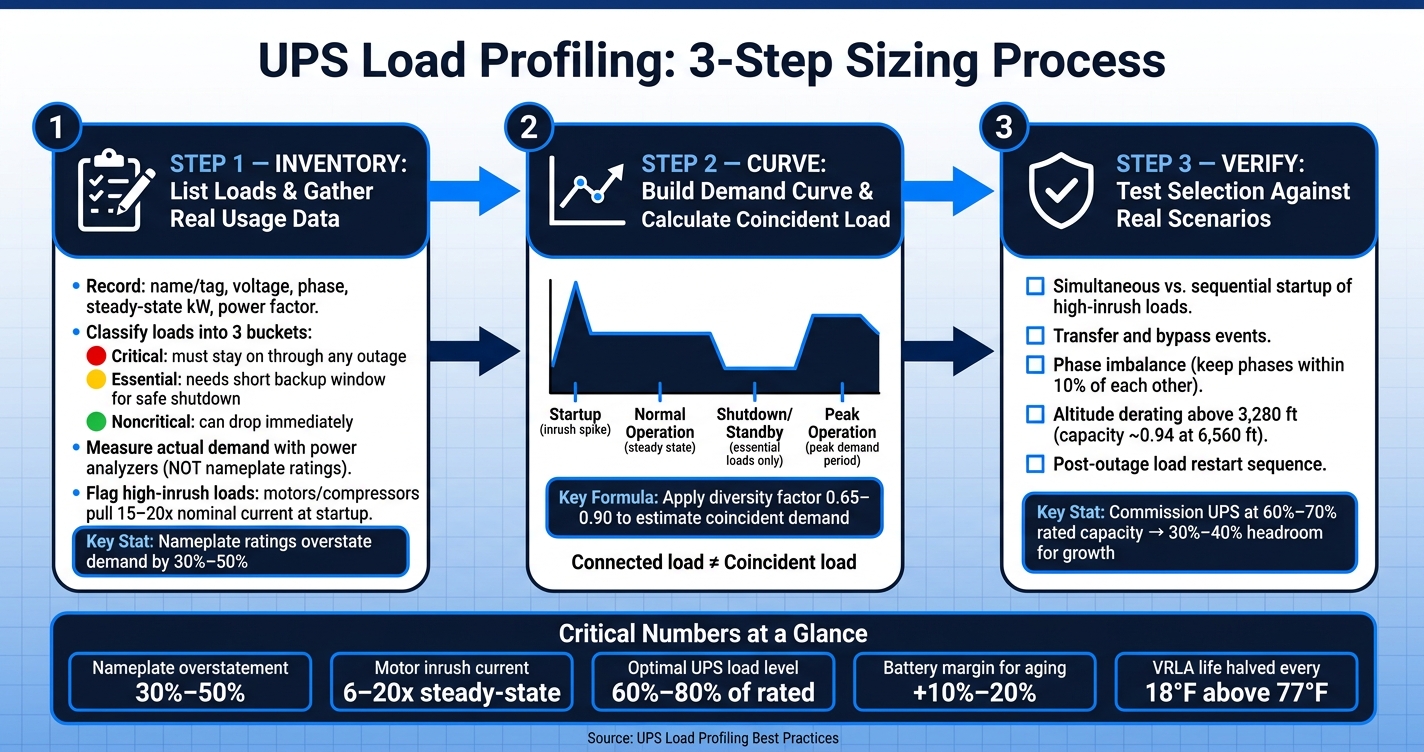
You can turn those sizing inputs into a simple three-part process: inventory, curve, verify.
List Loads and Gather Real Usage Data
Start with a full circuit and equipment inventory. For each item, record the name or tag, nominal voltage, phase setup, steady-state kW or amps, and power factor.
Then group each load into one of three buckets:
- Critical: must stay up through any outage
- Essential: needs a short window of backup power for safe shutdown
- Noncritical: can drop right away
After that, measure actual demand. Don’t size from nameplates alone. They’re a starting point, not the whole story. Use portable power analyzers or PDU monitoring, and log enough interval data to catch both daily swings and seasonal peaks.
Pay close attention to loads with high inrush current. Motors, compressors, and similar equipment can pull 15 to 20 times their nominal current during startup. If you miss that, the final UPS number can look fine on paper and still fail when equipment kicks on.
That inventory feeds the load curve.
Build the Demand Curve and Calculate Coincident Load
Once you have measured data, map demand across four operating modes: Startup (high inrush, sequential motor starts), Normal Operation (steady-state), Shutdown/Standby (essential loads only), and Peak Operation (peak demand period). Plot those modes across a typical day so you can see where demand actually spikes.
This matters because connected load is not the same as coincident load. In plain English, not everything runs flat out at the same time. So instead of stacking every worst-case number on top of the next, apply a diversity factor of 0.65–0.90 to estimate coincident demand. Then convert that result into the UPS kW and kVA you need.
That curve gives you something far more useful than a rough estimate: a picture of how the system behaves when the power situation changes.
Verify UPS and Battery Selection Against Real Operating Scenarios
Before you lock in equipment, test the selection against the conditions that put a UPS under strain. That includes simultaneous or sequential startup of high-inrush loads, transfer and bypass events, and phase imbalance. For sites above 3,280 feet (1,000 meters), include altitude derating. Rated capacity falls to about 0.94 at 6,560 feet (2,000 meters).
You also need to check how loads come back after an outage. This point can change the whole sizing result.
If loads restart sequentially, you can size for the largest single inrush plus the sum of the other running loads. If they restart all at once, the UPS has to handle the sum of all starting currents plus all running loads at the same time. That can drive the required capacity much higher.
Use the measured load profile as the baseline for procurement in the next step.
Applying the Results to Procurement and Facility Planning
Use the Load Profile to Specify Compatible Equipment
Once the load profile passes scenario checks, it should move straight into procurement requirements. At that stage, the profile isn’t just a planning document anymore. It becomes the basis for what the site needs to buy.
A finished load profile should spell out the UPS, batteries, protection, and distribution gear the facility needs, including kVA/kW capacity, battery chemistry, runtime, voltage, phase, and accessory needs such as PDUs, ATS units, and maintenance bypass switches. Size branch breakers at 125% of continuous load where applicable, and size upstream breakers, conductors, and maintenance bypass gear for maximum current. Use the runtime target to line up generator start and ATS transfer requirements.
The profile also needs to stay current. If equipment is added, retired, or moved, update it. Otherwise, the purchase spec can drift away from what the site will actually support.
Source Equipment with Clear Technical Requirements
Those requirements should show up directly in the RFQ. Once the profile is documented, procurement gets much simpler because the technical target is already clear.
The RFQ can state:
- required input and output voltage
- phase configuration
- kW and kVA demand
- allowable overload percentage
- runtime target
That kind of detail cuts back on back-and-forth with vendors and makes quotes easier to compare side by side.
Conclusion: Accurate Profiling Leads to Better UPS Sizing
That’s the whole point of profiling: turning operating data into a purchase spec you can defend. A documented load profile turns sizing into a purchase spec, which helps cut down commissioning surprises and later change orders.
FAQs
How long should I measure load before sizing a UPS?
Measure power draw long enough to show your normal operating pattern, including business hours, quieter periods, and batch processing windows. A common approach is 72 hours, which helps include both high and low usage.
The right length depends on your setup. For example, don’t monitor during weekends or holidays if the facility is empty, because that can skew the data.
When should motor loads be kept off the UPS?
Keep non-essential motor loads off the UPS.
Why? Because adding them can drive up costs, cut battery runtime for critical systems, and trigger startup inrush that pushes the UPS into overload and forces bypass mode.
Here’s the big issue: motors can pull 15 to 20 times their normal current at startup. That spike can hit hard and fast.
If a motor is essential, start it on bypass and transfer it to the inverter once the load is steady.
How much headroom should I leave for future growth?
A common rule of thumb is to add a 15% to 25% capacity buffer for future growth and short-term operating spikes. In practice, that often means multiplying your steady-state load by 1.2 to 1.25.
You also need to factor in inrush current, which matters a lot with inductive loads. Motors, compressors, and similar gear can pull more power at startup than they do during normal operation. If you skip that step, the UPS may look fine on paper but struggle when equipment kicks on.
A good target is to keep the UPS running at about 80% of its rated capacity. That gives you some breathing room instead of pushing the unit to the edge all the time.
For longer-range planning, 15% growth over five years is a standard benchmark, though some facilities may need more.