

IoT Feeder Monitoring for Outside Substations
If you want feeder visibility without reworking the substation, start at the feeder head. I’d sum this up like this: put sensors on the first pole, riser, or cable section outside the fence, send the data into SCADA or analytics, and use it to cut outage patrol time, check voltage and loading, and plan upgrades with better records.
Here’s the short version:
- Where to monitor: the first span or cable section leaving the substation, usually on 4.16 kV to 34.5 kV feeders
- What to install: FCIs, line sensors, power quality monitors, and in some cases PMU-class devices
- What the data shows: fault direction, fault timing, load, voltage, harmonics, and event records
- How to place devices: start before feeder splits, then add points at branches, risers, large taps, and repeat trouble spots
- How to move the data: fiber, private LTE, public cellular, RF mesh, or LoRaWAN, often through an edge gateway
- What utilities get from it: fewer patrol miles, faster service checks, overload alarms, and better upgrade timing
A few numbers stand out:
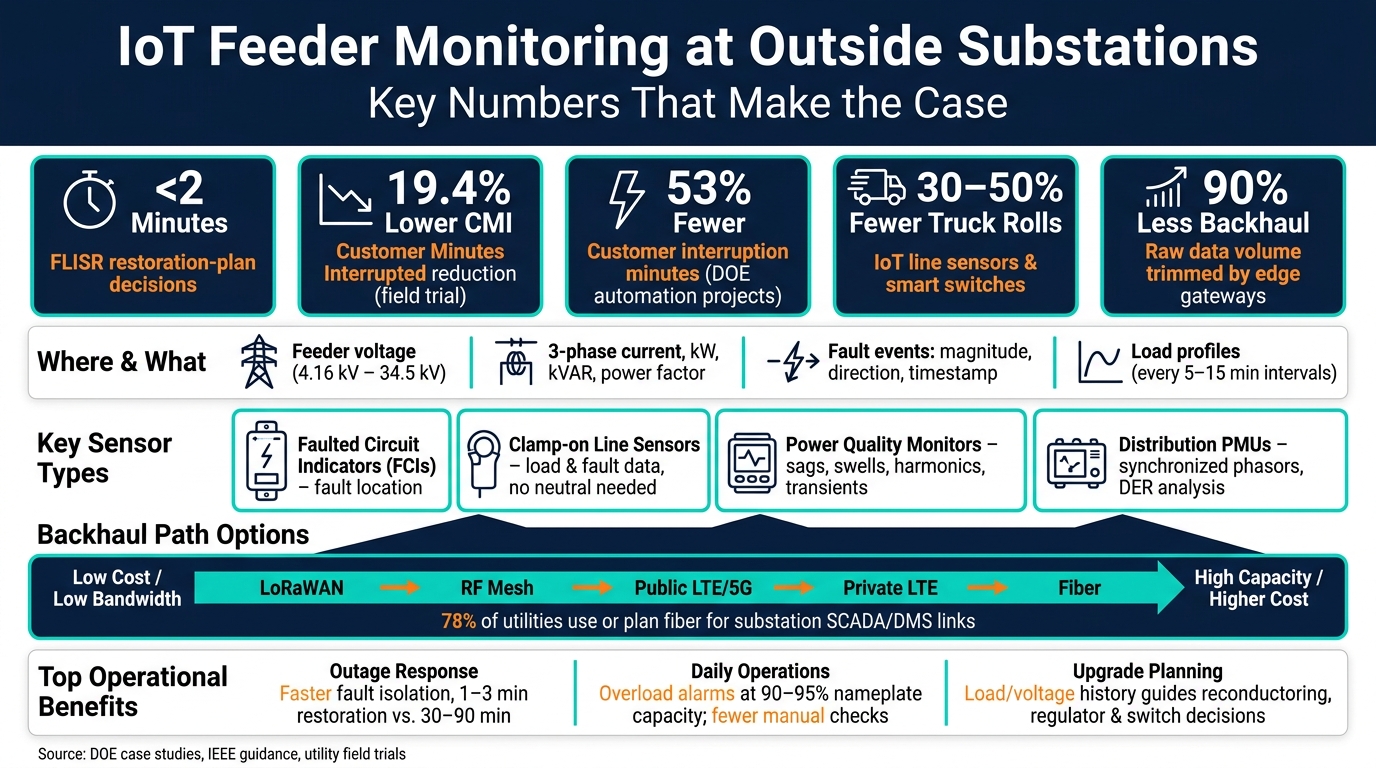
- FLISR schemes have supported restoration-plan decisions in under 2 minutes
- One field trial showed up to 19.4% lower CMI
- DOE case studies reported up to 53% lower customer interruption minutes in some automation projects
- IoT line sensors and smart switches have cut truck rolls by 30% to 50%
- Edge gateways can trim raw backhaul volume by about 90%
If I were explaining this to a utility team in one sentence, I’d say this: monitor the feeder as it leaves the yard, connect that data to the systems you already use, and let it guide outage response, daily checks, and capital planning.
| Focus area | Main point |
|---|---|
| Best location | First point outside the substation fence |
| Main use | Fault checks, load and voltage monitoring, service restoration |
| Best fit | Utilities that want feeder data without substation rewiring |
| Top challenge | Choosing the right device mix, placement, and backhaul path |
That’s the core idea of the article, and the rest builds on those choices.
IoT Feeder Monitoring: Key Stats & Benefits for Outside Substations
Devices and Placement on Feeders Leaving the Substation
Common Device Types at Feeder Exits
Once you’ve identified the feeder head, the next step is picking the sensing device. At feeder exits, four device groups show up most often.
Faulted circuit indicators (FCIs) show whether fault current passed a given point on the line. That helps crews narrow down the outage section much faster. IEEE guidance describes them as devices applied on 5, 15, 25, and 35 kV primary distribution circuits that "reliably indicate the occurrence of a fault beyond that location." Some advanced FCIs also provide current, voltage, and temperature data on underground cables.
Clamp-on line sensors take measurements without cutting the conductor. For example, the Sentient Energy MM3 samples at 130 samples per cycle at 60 Hz and provides utility-grade load and fault data without needing a neutral connection. That can make retrofits much easier on older circuits.
Power quality monitors record waveforms tied to sags, swells, transients, and harmonic events. They’re useful when customer complaints point to disturbance issues instead of clear fault events.
Distribution PMUs add synchronized phasor data, which helps with disturbance analysis and with understanding DER effects at the feeder edge.
Placement Strategies for Better Coverage
After the device choice, placement does a lot of the heavy lifting. A practical rule is to install sensors before feeder splits so fault detection is more precise. Older SCADA setups often relied on one or two sensing points per feeder. More advanced grid designs use three to five when utilities need closer visibility across laterals and branches.
That extra visibility can pay off. In one field trial, sensor data paired with calculated fault location cut Customer Minutes Interrupted (CMI) by up to 19.4%.
From the feeder head, utilities often add devices at:
- Branch points
- Large load taps
- Underground risers
- Known trouble spots with repeat outages
The same logic applies on underground circuits, but the access points are different. If there’s no pole-top span, monitoring usually moves to pad-mounted gear, vaults, switch cabinets, elbows, terminations, and splice points.
It also helps to line up sensor locations with reclosers, sectionalizing switches, and feeder relays. That way, operators can confirm faults faster without sending a crew out right away.
Equipment Used Around the Monitoring System
The sensors don’t work alone. A feeder-monitoring setup usually also includes breakers, reclosers, instrument transformers (CTs and PTs), surge protection, and outdoor-rated enclosures.
Instrument transformers matter most when measurements are taken straight from medium-voltage lines. But there’s a catch: they can introduce magnitude and phase errors, so those errors need to be accounted for.
To finish the installation at the substation edge, utilities also add grounding, bonding, antenna mounts, and weatherproof enclosures.
sbb-itb-501186b
What Data These Systems Capture and How It Helps
Fault Visibility at the Feeder Head
Once the feeder head is instrumented, the focus changes. It’s no longer just about where to place devices. It becomes about what operators can learn from the data.
At the feeder head, sensors turn an outage into a usable event record. They show fault magnitude, type, direction, and timestamp, which helps operators tell the difference between substation-side issues and downstream faults. And they don’t just record hard faults. These devices also track momentary interruptions, voltage sags, and source-loss events.
That matters in the field. Instead of sending crews to patrol an entire feeder, operators can narrow the patrol area much faster. They can confirm the likely problem zone before dispatching a crew. The U.S. Department of Energy documented that 16 utilities using distribution automation, including feeder monitors and remote fault indicators, avoided about 146 million customer-minutes of interruption over three years.
Fault records help with outage response. Load and voltage data help with day-to-day operation and planning.
Load, Voltage, and Power Quality Monitoring
In daily use, the most useful data is often the load profile.
Feeder monitors can report per-phase current, kW, kVAR, kVA, and power factor on a near-real-time basis. When loading gets close to 90% to 95% of nameplate capacity, monitors can send overload alarms into SCADA or a distribution management system. That gives operators time to shift load, dispatch local generation, or adjust voltage before equipment trips.
Phase imbalance is another big issue. If per-phase readings stay uneven over time, that usually points to uneven single-phase distribution. The result is higher neutral currents and faster transformer wear.
On feeders with inverter-based DER or large industrial loads, power quality data becomes more important. Utilities often watch total harmonic distortion (THD) and specific harmonic orders like the 3rd, 5th, and 7th. High harmonic levels can stress equipment and cause nuisance trips.
Those trends help utilities decide where to relieve overloads, correct voltage problems, and reinforce the feeder. They also set up the communications choices discussed in the next section.
Sensor Types and Data Depth: Comparison Table
The comparison below shows how data depth changes by sensor class.
| Sensor Type | Measured Parameters | Waveform / Event Detail | Primary Planning Value |
|---|---|---|---|
| Basic Fault Indicator (FCI) | Binary fault-passed indication; sometimes direction | None (event flag only) | Guides crews to faulted segment |
| Standard Line Sensor | 3-phase current, voltage, fault magnitude/direction, load profile | Cycle-level data, sequence components; up to 32 samples/cycle | Load growth tracking, overload alarms, FLISR input |
| Power Quality Monitor | Current, voltage, THD, harmonics, sags/swells, transients, flicker, power factor | High-resolution waveforms; event classification per IEEE 1159 | Capacitor/regulator evaluation, harmonic mitigation, DER integration |
| PMU-class device | Synchronized voltage/current phasors, frequency, ROCOF | GPS-timestamped phasors at 30–60 samples/second; TVE < 3% per IEEE C37.118 | State estimation, oscillation detection, relay verification, DER dynamics |
In practice, utilities don’t usually rely on just one sensor type. A common setup looks like this:
- Basic indicators downstream for fault segmentation
- Standard line sensors on key branches and at the feeder head
- Power quality monitors on circuits that serve sensitive loads
- PMU-class devices at substations where DER integration or stability analysis is a top concern
Communications, Integration, and Remote Monitoring
Backhaul Options Near Outside Substations
Once feeder-head sensors are installed outside the substation fence, the next job is simple in theory and tricky in practice: get that data back to the control center without creating a headache. The link you pick affects cost, delay, and how much upkeep the system needs.
Fiber is still the go-to option near substations. About 78% of utilities surveyed either currently use or plan to use fiber to connect SCADA and DMS systems to substations. If fiber is already at the site, it’s usually the cleanest high-capacity path.
When fiber doesn’t make sense - especially on rural feeders with long line runs - private LTE on utility-controlled spectrum such as 900 MHz, 1.4 GHz, or CBRS at 3.5 GHz can be a strong fit. It lets the utility manage quality of service and cybersecurity rules directly instead of relying on a carrier. Public LTE and 5G can work well for noncritical monitoring where carrier service is steady, but the monthly cost per device can add up fast.
RF mesh is another option, often using the same 900 MHz networks already put in place for AMI. In suburban and urban areas, that can extend to feeder sensors by using existing collectors. LoRaWAN works best for noncritical, low-bit-rate telemetry, like temperature data or partial discharge status, where long range and low power matter more than speed. LoRaWAN systems for distribution monitoring are already in use in major U.S. cities such as New York City and Chicago.
A setup utilities often use looks like this: short-range sub-GHz radios connect pole sensors to a fence-line gateway, and then fiber or cellular carries the data to the control center. That keeps recurring sensor costs down and puts most of the backhaul spend in one place.
After the communications path is set, the next step is getting feeder data into SCADA, historians, and analytics tools in a form people can actually use.
Protocols and System Integration
Feeder data has little value if it can’t move into SCADA and analytics systems in a usable format.
DNP3 is still the main protocol in North American utility operations for SCADA and distribution communications. It supports polling, unsolicited reporting, and timestamping in a way that lines up with how many SCADA masters already work. IEC 61850 is gaining ground in newer substations, especially for fast peer-to-peer messaging between intelligent electronic devices (IEDs).
For historians, analytics platforms, and cloud dashboards, MQTT and HTTPS/REST are showing up more often. These protocols move feeder sensor data from fence-line gateways into engineering analytics and planning systems, feeding SCADA, OMS, and analytics tools without forcing changes in the SCADA layer itself.
Edge gateways near the substation connect these systems. A gateway can pull in streams from several pole-mounted sensors, normalize the data, and present feeder data to SCADA like an RTU-style point while also publishing to MQTT for analytics. It can also trim raw data volume by about 90% before backhaul. That helps keep fault detail while cutting bandwidth use.
Those integration decisions shape how fast operators can use feeder data for outage checks and system planning.
Wired vs. Wireless Communications: Comparison Table
The tradeoff is pretty direct: higher-capacity links can handle richer data, while lower-cost wireless options are better for lighter telemetry.
| Attribute | Wired (Fiber) | Wireless (Cellular / Private LTE) | Wireless (RF Mesh / LoRaWAN) |
|---|---|---|---|
| Installation cost | High - trenching, splicing, right-of-way | Low to moderate - hardware on existing structures | Low - uses existing AMI or unlicensed spectrum |
| Latency | Milliseconds; suitable for protection-class traffic | Tens to hundreds of milliseconds; adequate for monitoring | Seconds; suitable for non-critical telemetry only |
| Bandwidth | High (suitable for waveform and high-resolution data) | Moderate (sufficient for IoT feeder monitoring) | Low to moderate (10–500 kbps per device) |
| Resilience | High; immune to RF interference | Moderate; depends on carrier or private network uptime | Moderate; multi-hop mesh adds path redundancy |
| Maintenance burden | Low ongoing; periodic inspection, storm damage repair | Moderate; firmware patching, modem lifecycle, antenna upkeep | Moderate; RF engineering, collector maintenance |
| Recurring service cost | None (utility-owned) | Ongoing carrier fees per device | Minimal if using owned spectrum or existing AMI backhaul |
| Cybersecurity posture | Strong physical security; still requires logical controls | Requires VPN or private APN over public carriers; private LTE gives more control | Requires encryption and credential management; public spectrum adds RF attack surface |
Operations, Upgrade Planning, and Conclusion
Faster Service Checks and Fewer Truck Rolls
Once feeder data reaches SCADA or the control room, operators can use it right away. Dispatchers can check feeder-head voltage, breaker status, and reclose status before sending a crew. That matters because it helps the team see what's happening before a truck ever leaves the yard.
IoT line sensors and smart switches can reduce truck rolls by 30% to 50% and cut restoration time to 1 to 3 minutes instead of 30 to 90 minutes. Interval load data recorded every 5 to 15 minutes can also take the place of routine manual peak-load checks.
Using Historical Data for Upgrade Planning
The same feeder-head data used during outages also helps with long-range planning. Load and voltage records show when reconductoring, regulator adjustments, or added capacity may be needed. Over time, those records make weak spots a lot easier to spot.
Fault history tells its own story too. If the same feeder segment keeps faulting, IoT event logs can show where an automated recloser or mid-feeder switch could shrink outage impact. When dispatch logs are matched with IoT events, utilities can put a dollar figure on the labor cost of repeated patrols.
DOE case studies of distribution automation projects show that self-healing FLISR functions have reduced customer minutes of interruption by up to 53% and the number of affected customers by up to 55%.
When monitoring data shows where upgrades are needed - such as new switchgear, transformers, reclosers, or capacitor banks - the next step is procurement. Electrical Trader lists new and used power distribution equipment, including medium-voltage breakers, padmount transformers, voltage regulators, and load-break switches.
Conclusion: Key Takeaways for Outside-Substation Feeder Monitoring
At the feeder head, even small monitoring improvements can add up fast: quicker restoration, better planning, and fewer wasted trips. Devices installed at feeder exits capture feeder voltage, three-phase current and power, fault events, and load profiles. Communications links then move that data into day-to-day operating systems.
The table below shows where this equipment helps most and where utilities need to be careful.
| Dimension | Key Benefit | Common Challenge |
|---|---|---|
| Outage response | Faster fault isolation | Communications availability during storms |
| Operations efficiency | Less field time | Staff training on dashboards and feeder data |
| Upgrade planning | Better upgrade timing | Integrating data with existing planning tools |
| Lifecycle and maintenance | Sharper capital planning | Sensor firmware, calibration, and field access |
The biggest gains show up when feeder data flows straight into OMS, DMS, and planning tools instead of sitting in a separate dashboard. That's the difference between a monitoring project that looks good on paper and one that improves reliability in day-to-day utility work.
Future Distribution Substation - IoT connectivity integrated
FAQs
Why monitor the feeder outside the substation fence?
Monitoring feeders beyond the substation fence gives utilities a much clearer view of what’s happening on the grid. The substation can only show part of the picture. Add sensors on poles or inside feeder cabinets, and utilities can spot faults, local loading problems, and reverse power flow from distributed energy resources.
That live data helps crews check service issues faster, plan upgrades with more precision, and isolate problems earlier. It also gives teams a way to verify that protection settings and equipment can handle bidirectional power flow.
Which sensor type fits my feeder best?
For feeder monitoring outside substations, use a line sensor that measures both voltage and current and supports fault detection and reverse power flow detection. Install it on poles or inside the feeder cabinet to get clear fault visibility and local load data you can act on.
For feeders with higher current, use CT-operated metering. Use direct-connect metering only on smaller feeders that stay within the meter’s amp rating.
How does feeder data reduce outage time?
Feeder data cuts outage time because it gives operators and automated systems like FLISR a live view of feeder conditions. That makes it easier to spot faults, isolate the affected section, and reroute power in seconds instead of hours.
It also supports remote monitoring and predictive analytics. In plain terms, teams can catch trouble earlier, deal with issues before they get worse, and cut back on manual inspections and emergency repairs.