Case Studies: Data-Driven Outage Mitigation
Power outages cost millions every year, but data-driven solutions are transforming how utilities handle them. By leveraging real-time monitoring, predictive analytics, and automation, companies can now prevent outages before they occur, reduce downtime, and save money. Here’s what you need to know:
- Real-time monitoring: Tools like IoT sensors and smart meters provide live updates on equipment health, helping utilities act before failures happen.
- Predictive modeling: Advanced analytics identify high-risk assets and predict restoration times with up to 3x more accuracy, saving $20–$30 million annually for some utilities.
- Automation: Self-healing grids and smart reclosers reduce outage durations dramatically, as seen in Chattanooga’s Electric Power Board, which cut annual outage time by 45% and saved $26.8 million for customers.
These strategies combine data, smart technology, and durable equipment to improve grid reliability and reduce costs. Utilities can now shift from reactive fixes to proactive planning, ensuring faster responses and better resource allocation.
Resiliency from Data-Driven Data Centers | Schneider Electric

sbb-itb-501186b
Chattanooga Electric Power Board Automation Case Study
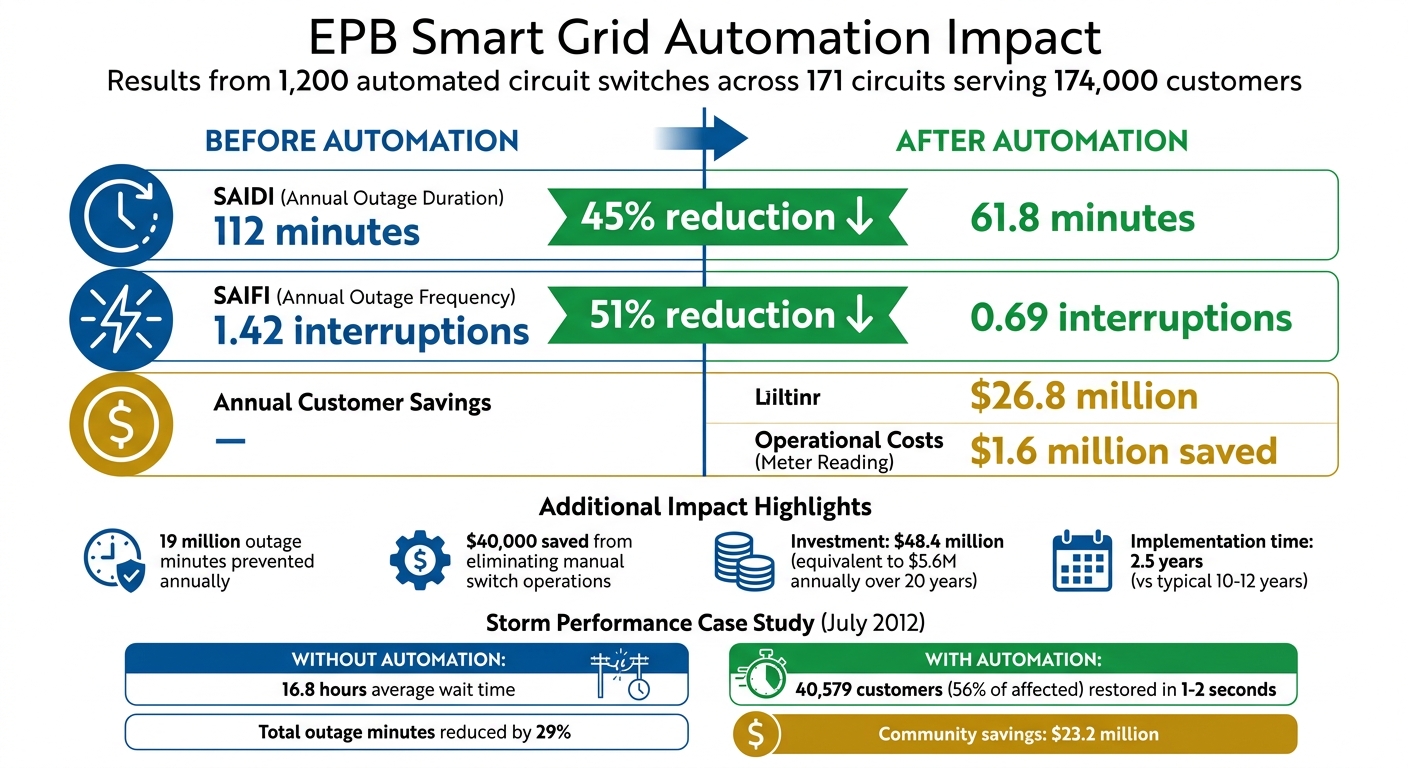
EPB Smart Grid Results: Before vs After Automation Metrics
The Electric Power Board of Chattanooga (EPB) revolutionized its distribution system by creating a self-healing grid. They achieved this by installing 1,200 automated circuit switches and sensors across 171 circuits, serving roughly 174,000 customers. Data from these devices is transmitted through an 8,000-mile fiber optic network, allowing the grid to detect faults and reroute power within seconds - often before customers even notice a disruption.
In 2009, EPB received a Smart Grid Investment Grant from the Department of Energy (DOE), which dramatically accelerated their timeline. What would typically take 10–12 years was completed in just 2.5 years, thanks to a $48.4 million investment - equivalent to about $5.6 million annually over 20 years.
Before and After Automation Metrics
EPB's automation initiative has significantly improved reliability and cost-efficiency. Here’s how the numbers stack up:
| Metric | Before Automation | After Automation | Improvement |
|---|---|---|---|
| SAIDI (Annual Outage Duration) | 112 minutes | 61.8 minutes | 45% reduction |
| SAIFI (Annual Outage Frequency) | 1.42 interruptions | 0.69 interruptions | 51% reduction |
| Annual Customer Savings | - | $26.8 million | - |
| Operational Costs (Meter Reading) | Baseline | $1.6 million saved | - |
The system prevents nearly 19 million outage minutes each year, saves $1.6 million annually by automating meter reading, and eliminates $40,000 in costs from manual switch operations.
Real-Time Monitoring for Outage Prevention
EPB’s real-time monitoring system pulls data from 175,000 smart meters and automated switches, offering a detailed view of grid performance. The fiber optic network ensures this data is transmitted continuously, enabling quick fault detection and response.
"The Automated Grid monitors energy delivery, detects problem areas and instantly reroutes power in seconds when necessary." - EPB
This system proved its worth during a major storm in July 2012. The automation restored power to 40,579 customers - 56% of those affected - in just 1–2 seconds. Without automation, these customers would have faced an average wait time of 16.8 hours for manual restoration. The event reduced total outage minutes by 29% and saved the community an estimated $23.2 million in interruption costs.
EPB has also partnered with Oak Ridge National Laboratory to use the grid as a "living laboratory." This collaboration helps test advanced technologies like microgrids, voltage management, and advanced controls, continually improving grid reliability. The case demonstrates how real-time data and automation can transform grid performance and community resilience.
Cluster-Based Outage Restoration Prediction Case Study
Predicting how long it will take to restore power after an outage is no easy task. The SDESC (Spatial Density-based Clustering) method addresses this challenge by grouping past outage events into clusters and training specialized machine learning models for each group. The idea is simple but powerful: not all outages are alike. For example, a storm-related outage in a rural area might require a completely different restoration approach than an equipment failure in a busy city.
To tackle this, utilities rely on advanced machine learning models like Random Forest, XGBoost (eXtreme Gradient Boosting), LightGBM (Light Gradient Boosting Machine), and CatBoost (Categorical Boosting). These models are also tested against more traditional methods like Ridge and Lasso regression to gauge their effectiveness. The clustering process groups outages based on factors like location, weather conditions, and the severity of their impact. This allows each model to specialize in predicting restoration times for specific types of outages. The next sections break down the inputs and processes that make this method work.
Model Inputs and Features
The SDESC method pulls together a wide range of data to make accurate predictions. Historical outage records, such as those from platforms like EAGLE-I, provide detailed information about disruptions. When combined with weather data and utility-specific information, this creates a rich dataset for training the models.
Key inputs include population density in affected areas, dew point readings, weather severity metrics, the number of customers impacted, and past repair durations. By blending weather data with utility records, these models can predict not just the likelihood of outages but also their potential scale and location. This helps utilities get ahead of the problem, positioning crews and equipment in advance of severe weather, instead of reacting after the damage is done. All these inputs feed into the models, which then generate highly specific restoration forecasts.
Converting Outage Data into Restoration Forecasts
Raw outage data is transformed into actionable restoration estimates. This process helps utilities monitor progress in real time, visualize the extent of damage as it unfolds, and adjust their resource allocation based on the actual situation rather than relying on static predictions. Using machine learning, the models identify patterns in the data that reveal what factors make an outage more complex or time-consuming to resolve.
Similar to the rapid fault detection seen in the EPB case, these forecasts allow utilities to deploy crews and equipment proactively. They also support scenario planning, offering best-case, worst-case, and most likely restoration timelines. This approach improves communication with customers by replacing vague estimates with more precise restoration times based on comparable past events.
AI-Based Forecasting for Utility Grids Case Study
Artificial intelligence is transforming how utility companies manage their grids, making operations smarter and more efficient. By analyzing data from SCADA systems, weather stations, and smart meters, AI can predict equipment failures before they happen. This shift from reactive fixes to preventive actions is already delivering measurable results. It builds on earlier automation strategies but takes things further by focusing on predicting and preventing problems.
In April 2025, Eversource Energy teamed up with EY US to roll out an AI framework that combined SCADA data, weather patterns, and geographic information. Within just two months, this system helped prevent 40,000 outages by identifying high-risk conditions and enabling crews to act proactively. According to Eversource's Automation and Analytics Leader, the rapid success raised questions about how utilities can tap into existing data and AI/ML algorithms to deliver noticeable reliability improvements in less than 60 days.
The financial upside is just as impressive. A southern electric utility partnered with NTT DATA to replace its traditional tree-trimming schedule with an AI-driven model. This model prioritized feeders based on their potential impact on Customer Minutes Interrupted (CMI), saving the utility $20 million to $30 million annually in outage-related costs. Similarly, European utility RWE worked with GE Vernova to deploy a random forest machine learning model. By analyzing nearly 30,000 historical outage reports alongside weather data from 2006 to 2015, the model achieved 75% to 88% accuracy in predicting outages.
AI Compared to Conventional Methods
The contrast between traditional methods and AI-powered forecasting is striking, especially in how utilities approach grid management:
| Feature | Conventional Methods | AI-Based Forecasting |
|---|---|---|
| Monitoring Approach | Manual inspections and periodic sensor checks. | Real-time, continuous monitoring through SCADA and AMI integration. |
| Risk Management | Reactive; fixes occur after failures. | Preventive; identifies and addresses risks before failures happen. |
| Operational Model | Scheduled maintenance on fixed intervals. | Data-driven; prioritizes assets based on risk and impact. |
| Outcomes | High emergency costs and unexpected downtime. | Lower emergency costs, better resource use, and improved reliability. |
Weather-related events account for about 70% of power outages. AI models tackle this by combining real-time weather data with insights on asset health. This enables utilities to pre-position crews and equipment ahead of storms. For example, during Hurricane Francine in 2024, one utility used the GridInform Storm Insight platform to manage 3,000 outages affecting 200,000 customers. Impressively, the platform predicted 95% of restoration times within 24 hours.
Identifying High-Risk Assets
AI shines when it comes to identifying which equipment needs attention first. By analyzing factors like asset age, maintenance history, weather exposure, and operational stress, AI ranks feeders and substations by their risk of failure. This is especially critical since roughly 70% of major grid transformers have been in service for over 25 years, making them prime candidates for AI monitoring.
The benefits go beyond just identifying risks. For example, AI-driven prognostic models for solar inverters have cut unnecessary crew deployments by up to 66%. Additionally, AI-based asset management can slash total maintenance costs by as much as 56%. This targeted approach allows utilities to focus resources on the most critical assets, helping them meet regulatory requirements while keeping costs in check.
Key Takeaways from Data-Driven Case Studies
Three practices stand out in the case studies for driving results: real-time data integration, predictive modeling, and automation. By centralizing SCADA, GIS, weather, and IoT data, utilities shifted from reactive fixes to proactive risk management. This approach helped them identify vulnerabilities and tackle them in a more structured way.
Predictive modeling also made a big difference. Instead of sticking to fixed maintenance schedules, utilities began prioritizing assets based on potential Customer Minutes Interrupted (CMI). For instance, a southern electric utility saved $20–$30 million annually by using a statistical model to guide tree trimming schedules, focusing on feeders with the highest projected outage costs. Similarly, Alabama Power used "Grid Inform" analytics to deploy smart reclosers, boosting SAIFI by 70%.
Automation played a crucial role in improving grid reliability. Smart reclosers, for example, could detect and automatically clear temporary faults - issues that make up 71% of detected problems. These reclosers replaced traditional fuses, preventing temporary faults from turning into prolonged outages.
One underlying theme across all these initiatives was the importance of strong physical infrastructure. Data-driven strategies rely heavily on hardware that delivers consistent and accurate inputs. IoT sensors monitoring transformer loads, feeder voltages, and oil levels are only effective when paired with equipment designed to handle long-term stress. This connection highlights how digital advancements depend on durable physical systems to ensure grid resilience.
Equipment and Tools for Facility Power Management
Effective outage mitigation isn't just about advanced software - it also requires reliable electrical components that can handle real-time monitoring and tough operating conditions. Breakers are essential in automated fault detection, isolating problem areas quickly to prevent cascading failures. Transformers with built-in sensors provide vital data on load and thermal stress, feeding predictive models to flag high-risk assets before they fail.
For facilities with critical operations, emergency standby diesel generators from Electrical Trader offer a dependable backup during grid disruptions. These generators ensure that key systems - like monitoring equipment, communication networks, and control centers - stay operational during outages. When combined with smart monitoring tools, they create a layered defense that pairs predictive insights with reliable backup power, forming the backbone of any robust outage mitigation strategy.
Applying Data-Driven Methods in Your Facility
Start by evaluating your facility's data setup. To make informed decisions, you'll need to gather three main types of data: asset data (like network topology and substation details), operational data from sensors and monitoring systems, and historical incident reports. It's essential to focus on collecting high-quality data rather than just amassing large quantities. Manuel Weindorf, Technical Solutions Director at GE Vernova, emphasizes the importance of good data:
"To learn, the machine has to be taught well. In the next stages, we'd like to use more and better data."
Once you've established a solid data foundation, the next step is choosing a predictive model. Machine learning tools such as Random Forest, XGBoost, and LightGBM are particularly effective at handling complex, non-linear patterns that traditional statistical methods might miss. For example, in a study analyzing winter storm outages, the XGBoost model achieved an impressive R² score of 0.92, showcasing its high level of accuracy. These models excel when fed a variety of inputs, including meteorological data (like temperature, wind speed, and ice accumulation), geographical features (such as service area coordinates), and socio-economic factors like population density. By adopting these data-driven models, facilities can shift from reactive to proactive maintenance - focusing on managing assets based on risk rather than sticking to rigid, calendar-based schedules.
A key part of this shift involves transitioning to priority-based asset management. For instance, instead of trimming vegetation on a fixed schedule, facilities can rank infrastructure based on risk and potential savings in Customer Minutes Interrupted (CMI). To make this work, it's essential to use tools like Advanced Distribution Management Systems (ADMS) or integrated Outage Management Systems (OMS). These systems centralize data from smart sensors and offer real-time visualization through Geographic Information Systems (GIS).
Once risk assessments are in place, the next focus should be on strengthening physical infrastructure.
Creating Outage-Resistant Infrastructure
Combining predictive analytics with hardware upgrades is vital for building infrastructure that can withstand outages. Devices like cutout-mounted reclosers and intelligent reclosers are excellent tools for preventing temporary faults - responsible for 71% of detected issues - from escalating into sustained outages. For example, Alabama Power began deploying 1,500 S&C TripSaver II reclosers annually in January 2025, reducing sustained outages on targeted laterals from 2.1 to just 0.47 per year.
Another critical step is ensuring seamless integration of backup power systems, such as emergency standby diesel generators, with monitoring tools. Platforms like Electrical Trader offer solutions such as diesel generators, transformers with built-in sensors, and breakers designed for automated fault detection - essential for facilities embracing data-driven strategies. When selecting equipment, interoperability should be a priority. Look for platforms that support standard communication protocols to ensure new intelligent devices can work alongside existing infrastructure. A great example of this is Carroll Electric Membership Corp., which deployed Eaton's Form 6 reclosers with Brightlayer Utilities feeder automation software across 5,500 miles of line in February 2024. This move reduced outage durations by 38% while maintaining compatibility with equipment from various manufacturers.
Conclusion
Case studies highlight how data-driven strategies are changing the game in reducing power outage risks. By combining predictive models, real-time sensors, and geospatial analysis, utilities of all sizes are moving from reactive maintenance to proactive planning. This shift consistently improves outage metrics, reduces downtime, and speeds up restoration efforts.
The financial advantages are just as compelling. Utilities replacing calendar-based maintenance with priority-based systems have seen major cuts in outage-related expenses. For example, AI-powered platforms have slashed costs by 25%, thanks to improved planning and quicker responses. These savings make a strong case for investing in integrated, forward-thinking solutions.
The synergy between advanced software and dependable hardware is key to building resilient infrastructure. Tools like smart reclosers, IoT sensors, and automated switching systems can distinguish temporary faults from sustained outages, providing the physical backbone for these strategies. Platforms such as Electrical Trader supply critical components - like emergency standby diesel generators, sensor-equipped transformers, and automated fault-detecting breakers - that enhance system reliability.
These case studies reveal a clear evolution in outage management. Instead of waiting for equipment to fail or sticking to rigid maintenance schedules, organizations can now predict and prevent issues before they escalate. This proactive approach is paving the way for smarter, more efficient power management across diverse infrastructures and operational scales.
FAQs
What data is needed to predict outages?
To anticipate outages, several key data points are crucial. These include weather conditions, infrastructure status, historical outage records, asset information, vegetation and environmental factors, and real-time system monitoring. By analyzing this information, potential risks can be identified, allowing for more efficient and targeted response strategies.
How do utilities estimate restoration times more accurately?
Utilities are enhancing their ability to estimate restoration times by leveraging advanced analytical models and historical outage data. By incorporating artificial intelligence and statistical tools, they can significantly boost the accuracy of their predictions. These data-driven strategies allow utilities to provide more precise forecasts, leading to better service and faster response times.
Which grid upgrades cut outages the fastest?
Upgrading the grid with distribution automation systems that offer real-time fault detection and rapid isolation proves to be highly effective. For example, the use of automated fault interrupters and reclosers led to a 14.6% reduction in outage durations in one instance. Similarly, implementing automated circuit switches and sensors greatly improved response times. These tools allow for quicker fault isolation and restoration, making them essential for minimizing outage durations efficiently.