Best Practices for Industrial Demand Response Programs
Industrial Demand Response (IDR) programs help large facilities adjust electricity use to match grid demands. These programs can reduce costs, enhance grid stability, and improve renewable energy integration. Success depends on clear goals, load analysis, effective segmentation, and streamlined processes. Key takeaways:
- Define Goals: Focus on cost savings, grid support, or renewable integration.
- Understand Load Profiles: Analyze energy usage to identify flexible and critical loads.
- Segment Participants: Group facilities by flexibility and readiness for tailored strategies.
- Simplify Enrollment: Use audits and aggregators to reduce complexity.
- Plan Event Strategies: Use tiered approaches for minimal disruption; automate where possible.
- Verify Performance: Accurate baselines and post-event checks ensure fair compensation.
- Integrate Systems: Ensure equipment and automation systems can handle demand changes.
Setting Goals and Understanding Industrial Load Profiles
Setting Demand Response Objectives
Before joining an industrial demand response program, it’s essential to define clear and measurable goals. Broad objectives like "save energy" aren’t enough - your targets should directly align with your facility's operational priorities.
Most facilities focus on three key goal types:
- Economic: Lowering demand charges and energy costs.
- Grid-related: Contributing to peak shaving or frequency regulation.
- Sustainability-focused: Supporting the integration of renewable energy into the grid.
In many cases, facilities aim to achieve a combination of these goals. For example, in rapidly growing markets, demonstrating the ability to shift 15–25% of your load can lead to better interconnection terms with utilities and faster service agreement approvals. The type of goal you choose also determines the most suitable demand response mechanism. Programs based on pricing (like Time-of-Use or Real-Time Pricing) are ideal for managing costs over the medium to long term, while incentive-based programs (such as load curtailment or emergency response) are better for facilities that can make quick, significant load reductions.
Once your goals are set, the next step is to examine your facility’s load profile to uncover potential areas for flexibility.
Analyzing Industrial Load Profiles
After defining your objectives, review historical demand data using additive decomposition. This method breaks down your data into baseline trends, seasonal patterns, and irregular variations, helping you pinpoint whether your facility already responds to price signals and where consistent flexibility opportunities exist.
Next, classify your facility’s loads based on their controllability:
| Load Type | Flexibility | Examples | Key Constraint |
|---|---|---|---|
| Mechanical 1 | On/Off only | Press machines, grinders | Long switch times; no partial adjustments |
| Mechanical 2 | Adjustable | Pumps, fans, air compressors | Can be modulated with variable frequency drives |
| Thermal | Limited/Continuous | Smelters, induction furnaces | High restart costs; risk of process disruption |
| Storage-Augmented | High | Battery systems, thermal storage | Limited by capacity and discharge rates |
It’s also critical to differentiate between critical and noncritical loads. Critical loads are those where interruptions cause immediate economic losses, such as wafer defects in semiconductor plants or data integrity issues in data centers. Noncritical loads, on the other hand, often have buffers or can be shifted without impacting daily production. For example, grinding mills in cement plants - where electricity accounts for about 30% of production costs - are excellent candidates for load shifting since pausing them doesn’t disrupt the entire production line.
Finally, calculate your facility’s Customer Baseline Load (CBL). This baseline, typically based on the four highest-consumption days out of the five most recent weekdays (excluding holidays and demand response event days), serves as a benchmark for measuring reductions during events. It’s a vital tool for verifying performance and calculating incentives accurately.
Participant Segmentation and Enrollment
Grouping Facilities by Operational Flexibility
When designing demand response (DR) programs, it's important to recognize that not every industrial facility operates the same way. Grouping facilities based on their operational flexibility makes it easier to tailor programs that work for their specific capabilities.
Facilities can be categorized by their primary DR strategy, such as energy storage, scheduled energy usage, operational flexibility, on-site generation, or intelligent operations. Each strategy comes with its own pros and cons. For example, scheduled energy usage and on-site generation can reduce peak demand by as much as 70–80% in certain scenarios. However, these strategies often require significant adjustments to daily operations. On the other hand, energy storage systems demand less operational change but come with higher upfront costs and longer payback periods.
Flexibility can go in two directions: positive flexibility - reducing energy use or increasing on-site generation during high-demand periods - and negative flexibility, which involves increasing energy consumption to absorb excess grid supply during times of renewable over-generation.
Here's a quick look at how different industrial sectors align with their primary flexibility sources:
| Industrial Segment | Primary Flexibility Source | DR Potential |
|---|---|---|
| Pulp and Paper | High inventory of intermediate pulp | High (flexible scheduling) |
| Cold Storage | Thermal mass/storage | High (load shifting) |
| Cement | Grinding and milling processes | High (variable speed drives) |
| Wastewater Treatment | Biogas coupling and process storage | High (load shifting) |
| Metalworking | Electric furnaces (thermal mass) | Moderate (tight tolerances) |
"Industrial loads account for the largest share of demand-side capacity, representing over 50% of total energy consumption in society, with adjustable potential exceeding 25% of their total capacity." - Jiubo Zhang et al., Northeastern University
By clearly defining these categories, you can streamline program design and better match facilities to the right DR opportunities.
Simplifying the Enrollment Process
After segmentation, the next step is to make enrollment as simple as possible. Complicated rules and unclear expectations can discourage participation.
"Insufficient knowledge about the available flexibility is one of the main barriers for C&I consumers." - Roksana Yasmin et al., Federation University Australia
Start with a flexibility audit. This means identifying which operations can be interrupted, estimating the facility's realistic response potential, and documenting any constraints - like restart costs or product quality requirements - that could limit participation. Setting these expectations early helps reduce dropouts after enrollment.
For smaller facilities, working with a third-party aggregator can make a big difference. Aggregators handle the bidding process, combine resources from multiple sites, and ensure compliance with program requirements. This approach eases the administrative load on facility managers. Meanwhile, for facilities with highly sensitive processes - like chemical reactors or paper machines - contracts should include a risk premium to account for any costs tied to production disruptions.
Lastly, deploying tools like Advanced Metering Infrastructure (AMI) and Energy Management Systems (EMS) can automate responses and minimize the manual effort required for complex operations.
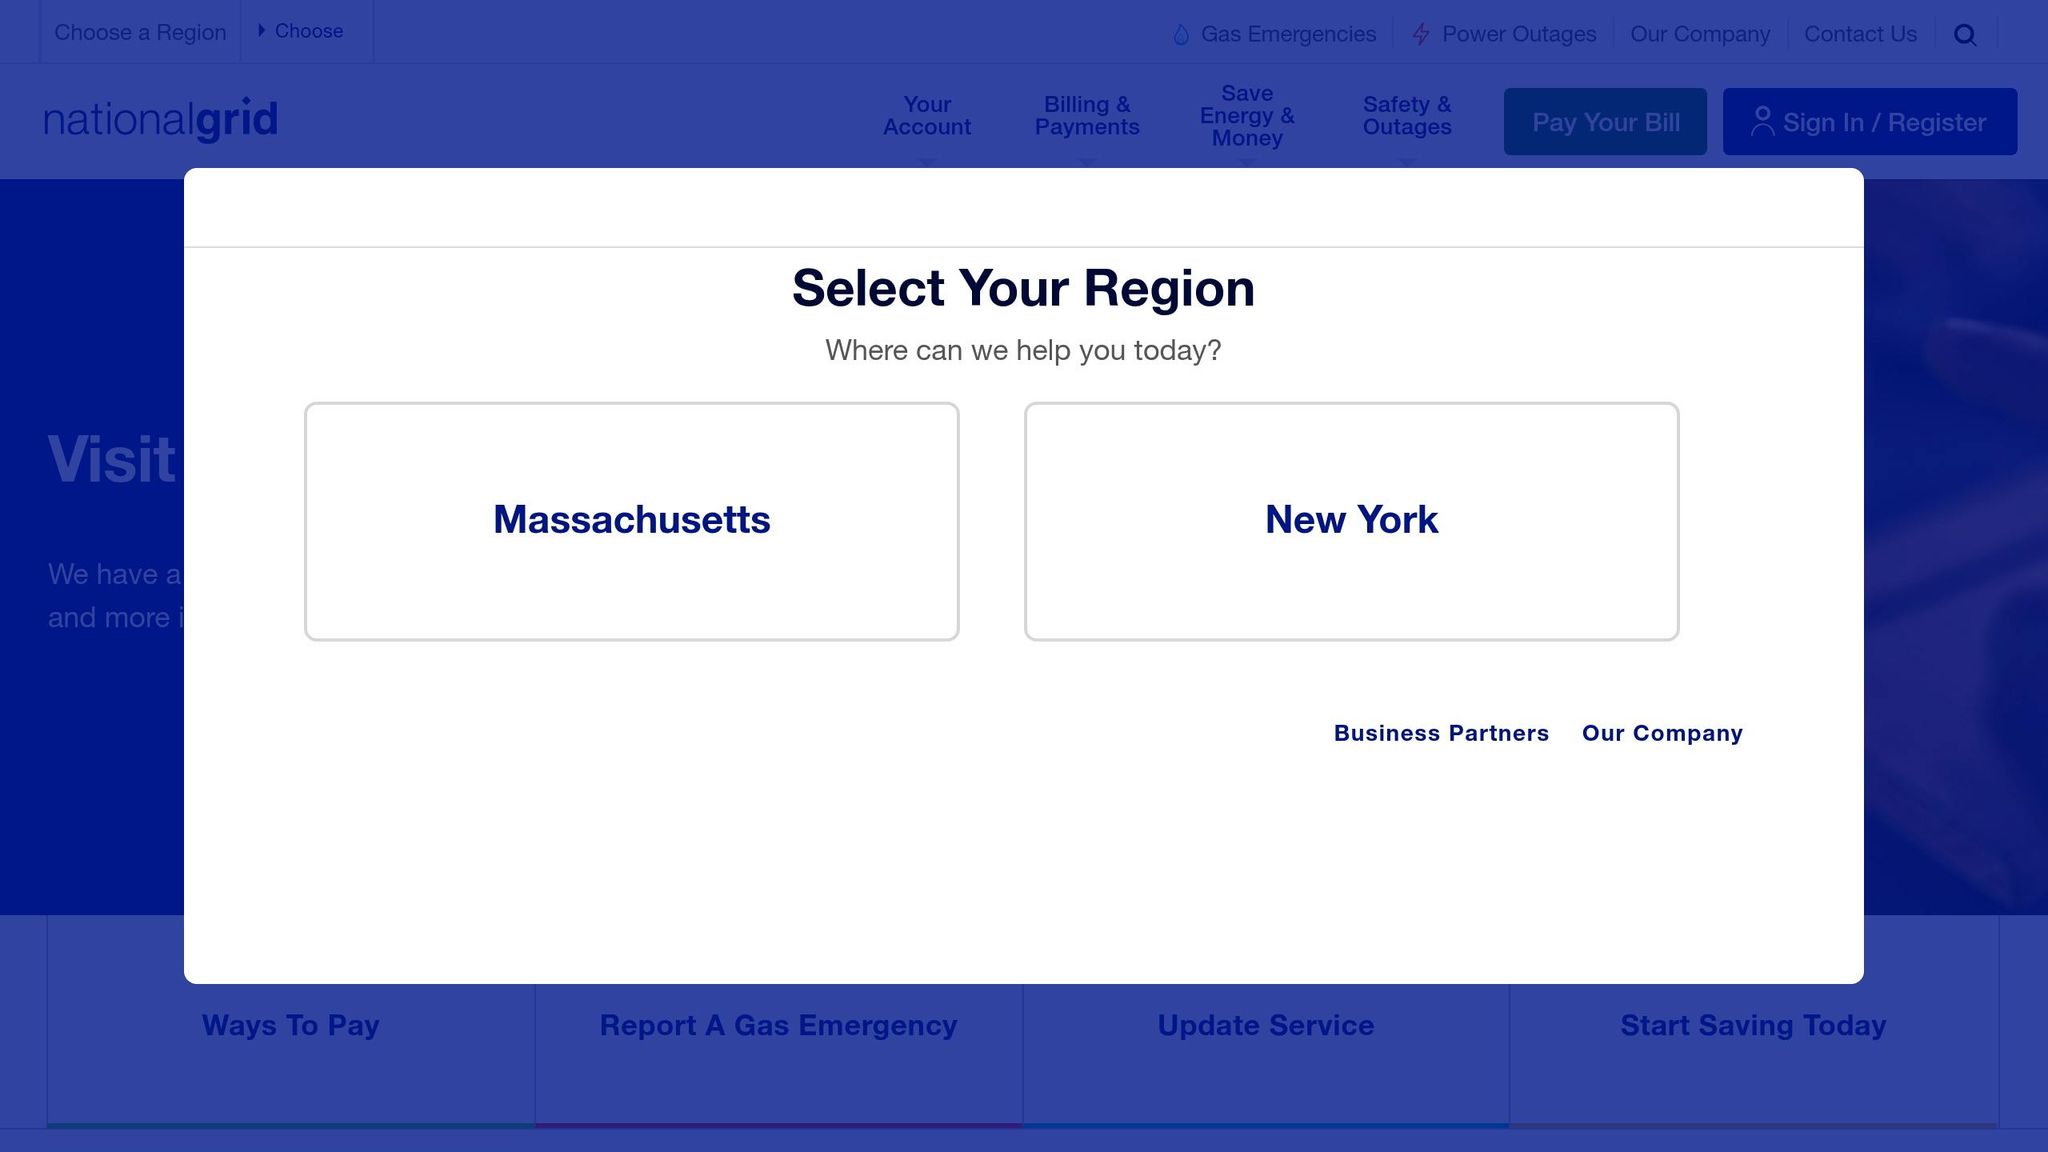
Electric Demand Response Program for commercial and industrial customers | National Grid
Event Strategies and Dispatch Rules for Industrial Loads
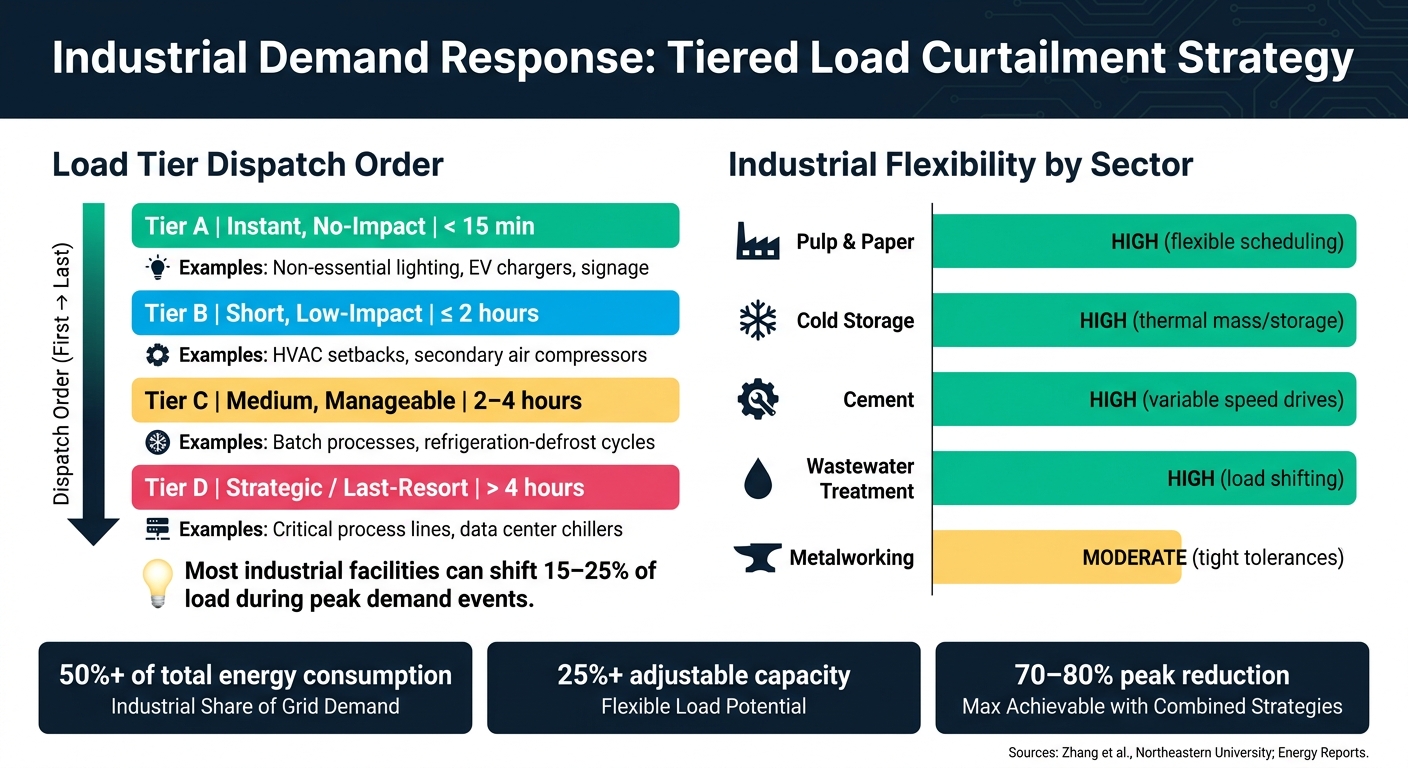
Industrial Demand Response: Load Tier Strategy & Flexibility by Sector
Balancing Event Timing and Frequency
Once you've nailed down your load profile analysis and enrollment strategies, the next step is setting up effective event dispatch rules. These rules are the backbone of successful demand response (DR) programs.
The key is to avoid treating DR events as interruptions. Instead, integrate them seamlessly into the production cycle. One way to do this is by categorizing facility loads into four tiers based on how much disruption their curtailment would cause:
| Load Tier | Impact Level | Typical Duration | Example Assets |
|---|---|---|---|
| Tier A | Instant, No-Impact | < 15 min | Non-essential lighting, EV chargers, signage |
| Tier B | Short, Low-Impact | ≤ 2 hours | HVAC setbacks, secondary air compressors |
| Tier C | Medium, Manageable | 2–4 hours | Batch processes, refrigeration-defrost cycles |
| Tier D | Strategic/Last-Resort | > 4 hours | Critical process lines, data center chillers |
Start with Tier A and B loads for immediate response, saving Tier C and D loads for situations where deeper reductions are necessary. This tiered approach minimizes disruption while still achieving substantial load reductions. Most industrial facilities can shift 15% to 25% of their load away from peak demand periods when needed.
Advance notice is another critical piece of the puzzle. A 24-to-48-hour day-ahead signal gives manufacturing teams enough time to adjust production schedules without causing emergency stops on active lines. Shorter notice periods, like the 10-to-30-minute window required by ERCOT's Emergency Response Service (ERS), are doable but demand pre-approved runbooks to ensure smooth execution. After an event, plan for a staggered restart to avoid creating a secondary demand spike. Bringing all loads back online at once can be just as costly as the original peak and disrupt the production stability you've worked hard to maintain.
Once you've nailed down the timing, the next step is selecting the right control method for execution.
Manual Curtailment vs. Automated Load Controls
Choosing the right control method depends on the criticality and risk associated with each load.
"Unlike audits or retrofits, curtailment is an event-driven discipline: when the grid operator calls, the clock starts, penalties loom, and every minute of hesitation erodes value." - Umbrex
For non-critical loads like lighting relays, BMS macros, and VFD settings, automated controls are the way to go. These systems can respond to grid signals almost instantly, without requiring anyone to be physically present. Semi-automated methods, like PLC scripts that pause conveyors or batch processes only after completing their current cycle, are a good middle ground. They reduce risks like product waste or equipment stress while maintaining efficiency.
Manual intervention, however, is still essential for high-risk actions. Tasks like isolating steam valves, shutting down electric furnaces, or stopping chemical feed systems require physical verification to ensure safety and protect product quality. Operators need the ability to override controls when necessary.
In 2024, the Alberta Electricity System Operator (AESO) introduced a program requiring large consumers to shed at least 300 kW within a 10-minute response window - a target that's nearly impossible to meet consistently with manual processes alone. Automation plays a critical role here, but it comes with its own challenges. For example, when curtailed systems restart, they often draw more power than usual, creating a rebound effect. To counter this, build a staged recovery sequence into the automation logic. This approach prevents secondary demand spikes and keeps production disruptions to a minimum.
Regular testing is also essential. Running quarterly 30-minute mock events allows you to measure actual kW reductions against targets and identify any issues before a real event occurs. It's a simple but effective way to ensure you're ready when the grid operator calls.
sbb-itb-501186b
Measurement, Verification, and Baseline Development
To complement the event strategies discussed earlier, an accurate measurement and verification (M&V) process is indispensable. Automated dispatch rules and tiered load controls only deliver results when backed by solid M&V that confirms actual performance. Without it, savings may go unverified, disputes over compensation can arise, and trust with grid operators could falter. This process underpins the creation of an accurate Customer Baseline Load (CBL), which ensures fair compensation.
"A reliable baseline is key for creating a DR offer in the market, and, without it, it would be impossible to verify effective load reduction and performance of the demand resource to settle a fair compensation." - Ottavia Valentini, Researcher
Establishing Baseline Energy Usage
The Customer Baseline Load (CBL) represents the estimated energy consumption if no demand response (DR) events had occurred. It’s the benchmark against which reductions are measured. Accuracy is critical - an incorrect baseline can lead to unfair compensation, whether too high or too low.
The choice of baseline method depends on how consistent your facility's energy usage patterns are:
| Method | Complexity | Best Use Case |
|---|---|---|
| Day-Matching | Low | Facilities with predictable, routine schedules |
| Regression Analysis | Moderate | Loads influenced by weather or production variability |
| STL + Gaussian Process Regression | High | Complex sites with "load step" patterns |
| AI / Deep Learning | Very High | Large-scale programs with extensive historical data |
For most industrial sites, regression analysis strikes a good balance of accuracy and usability. It factors in external influences like temperature or production levels, which simpler methods like day-matching overlook. However, for facilities with irregular patterns - such as batch processors or operations with frequent shift changes - STL decomposition can isolate production-driven trends with a high degree of precision. Case studies have shown this method achieving accuracy rates up to 91.4%.
To enhance baseline accuracy, follow these three practical rules:
- Use separate baselines for weekdays and weekends.
- Exclude sample days where the average load is either below 25% or exceeds 200% of the sample set’s average.
- Apply a 2–4-hour real-time adjustment window before an event to align historical baselines with the actual conditions of the event day.
Post-Event Verification and Reporting
Once an event concludes, verifying performance against the baseline ensures compensation integrity. The challenge lies in comparing actual consumption to an estimated counterfactual, which can lead to disputes or even strategic gaming - where participants inflate pre-event usage to artificially raise their baseline and secure higher compensation.
"Baseline load estimation should not be evaluated only as a forecasting exercise because its output is used directly in compensation, settlement, and performance verification." - Suhaib Sajid et al.
To create a defensible verification process, evaluate your baseline method against four key dimensions:
- Reliability: Minimize systematic errors.
- Practicality: Ensure the method is straightforward for all stakeholders.
- Fairness: Make it resistant to manipulation.
- Transparency: Keep it auditable for all parties.
Using high-resolution data from Advanced Metering Infrastructure (AMI) improves post-event analysis by providing detailed temporal data. This makes results more traceable and harder to challenge. Consistent post-event reporting - showing metered load, baseline estimates, and verified reductions - helps maintain trust with utilities and grid operators, ensuring the long-term success of your program.
System Integration and Equipment Compatibility
Once you’ve established a solid Measurement & Verification (M&V) framework, the next hurdle is making sure your facility’s control systems and equipment can handle demand response (DR) events without a hitch. Even the most accurate baselines won’t matter if your systems can’t act quickly when the grid sends a signal.
Integrating Demand Response with Automation Systems
The good news? Most industrial facilities don’t need to overhaul their existing controls to participate in DR. Typically, an integration layer can bridge the gap between legacy BAS/SCADA systems and modern DR platforms. This layer translates grid signals into standardized load-shed commands that your existing equipment can understand and execute.
However, legacy SCADA systems, which often operate with polling intervals of 30–60 seconds, may struggle to meet the sub-minute response times required for DR. Relying on manual curtailment in such cases can lead to delays and errors.
"Missed opportunities often come down to a customer's controls. Slower respondents tend to rely on building management systems (BMS) and supervisory control and data acquisition (SCADA) systems designed for monitoring, trending and alarms; not for fast, coordinated curtailment." - Karl Zimmerman, Founder and CEO, Energy IQ
Here’s a real-world example: In November 2025, CPower and Energy IQ implemented an automation layer at a 100 MW steel plant. This upgrade enabled the facility to shed 30 MW of load within just 10 minutes, resulting in annual revenue in the seven-figure range.
For successful integration, the layer must support standard industrial protocols like BACnet/IP, Modbus TCP, and MQTT. Before diving into integration work, it’s essential to conduct a controls-readiness assessment. This involves auditing your current polling rates, identifying supported protocols, and determining which loads can be automated without affecting production.
"Grid operators reward speed, automation, and reliability. Facilities that demonstrate those three things will continue to have access to higher-value DR opportunities." - Karl Zimmerman, Founder and CEO, Energy IQ
Once your automation system is in place, the focus shifts to ensuring your physical hardware can handle the operational demands of frequent load cycling.
Checking Equipment Compatibility
Automation software alone isn’t enough. Your physical hardware - such as transformers, breakers, and power management systems - needs to be up to the task of handling the mechanical and electrical stresses of DR events. One major concern is the rebound effect, which refers to the surge in demand when equipment powers back on after a DR event. If your breakers or transformers aren’t designed to handle this inrush current, repeated DR participation could lead to accelerated wear or even equipment failure.
Here are some key compatibility checks to perform before finalizing any load-shed sequence:
| Compatibility Factor | What to Verify |
|---|---|
| Breaker ratings | Ensure breakers can handle both load-shed actions and rebound inrush currents |
| Transformer capacity | Verify that transformers can manage rapid load fluctuations without overheating |
| Protocol support | Confirm that all components communicate using standard protocols like BACnet/IP, Modbus TCP, or MQTT |
| Data logging | Ensure equipment generates real-time logs for M&V and settlement purposes |
If your equipment doesn’t meet these requirements, you may need to source replacements. Platforms like Electrical Trader offer a wide range of new and used industrial components - including breakers, transformers, and power distribution equipment - to help you find hardware that aligns with grid-interactive operation standards.
Incentives, Communication, and Program Improvement
To keep participants engaged, it's essential to focus on fair incentives, effective communication, and ongoing program upgrades.
Building an Incentive Structure
Demand Response (DR) programs generally fall into two categories: price-based and incentive-based. Price-based programs - like Time-of-Use (TOU), Real-Time Pricing (RTP), and Critical Peak Pricing (CPP) - change electricity rates depending on when it's consumed. On the other hand, incentive-based programs (IBPs) provide direct payments for reducing energy use during specific events.
For large industrial facilities, IBPs often work better because these businesses can deliver the significant, event-driven reductions that grid operators need. However, when halting or shifting production is expensive, TOU pricing may be a better option to maintain productivity.
| Program Type | How It Works | Best For |
|---|---|---|
| Time-of-Use (TOU) | Fixed rates for peak and off-peak periods | Facilities that can shift loads without stopping production |
| Real-Time Pricing (RTP) | Hourly price updates based on wholesale market rates | Large commercial and industrial consumers with rapid response capabilities |
| Incentive-Based (IBP) | Payments for reducing load during specific events | Facilities that can deliver significant, event-driven reductions |
Combining strategies like energy storage, scheduled energy use, and on-site generation can reduce peak demand by as much as 70–80%. But even with the right incentives, clear communication is key to ensuring participants can act effectively.
Setting Up Clear Communication Channels
One common reason industrial participants leave DR programs is unclear expectations. While automation simplifies load management, streamlined communication ensures participants know exactly what to do during DR events.
DR Service Providers play a critical role here, translating complex grid signals into clear, actionable instructions. This eliminates the need for participants to have in-depth knowledge of energy markets. Using tools like Advanced Metering Infrastructure (AMI) and smart meters allows automated signals to trigger pre-programmed load management strategies, reducing the need for manual adjustments.
Transparency is also crucial. Participants need real-time access to their energy usage data to verify their performance and ensure they’re receiving accurate incentive payouts.
Using Feedback to Improve the Program
Beyond clear instructions, collecting and acting on feedback is essential for refining DR programs. Post-event reviews provide valuable insights for making targeted improvements. For example, gathering structured feedback from participants can highlight challenges that slowed their response or disrupted operations.
If feedback reveals consistent productivity losses, it may be time to shift from load curtailment (stopping energy use) to load shifting (moving energy-intensive processes to off-peak hours). The goal is to create a continuous improvement cycle: gather data, identify problem areas, adjust the program, and measure the results. This approach builds on the measurement and system integration processes established earlier in the program.
Key Takeaways for Industrial Demand Response Programs
A strong industrial demand response program starts with intentional planning. Success hinges on setting clear and measurable goals that align with operational priorities. These could include objectives like cutting peak demand charges by 10–40% or earning substantial capacity payments in wholesale markets. Without this groundwork, even the most advanced technologies or attractive incentives won’t ensure consistent results. This planning phase lays the foundation for refining program specifics, including segmentation and control strategies.
Participant segmentation is a critical factor that often gets overlooked. Grouping facilities based on how quickly and safely they can reduce load provides a realistic view of capacity and response times. For example, non-essential lighting might be adjusted within seconds, while critical process lines should only be modified as a last resort. This tiered strategy helps program managers avoid overcommitting during events while maintaining production quality and operational stability.
Another key element is ensuring equipment compatibility and system integration. Industrial processes are highly interconnected, and even minor load adjustments can lead to quality or safety issues if systems aren’t properly aligned. Using generic, interoperable data models instead of customized solutions minimizes the risk of vendor lock-in, making it easier to adapt and scale the program as it evolves.
"Combining multiple IDR strategies from these five categories maximizes both financial and operational benefits." - Energy Reports
Lastly, no program remains effective without ongoing refinement. Practices like quarterly dry runs, post-event scorecards, and structured feedback loops are what set continuously improving programs apart from those that stagnate. Facilities that view demand response as a strategic tool - not just a way to adjust billing - develop greater resilience to fluctuating energy prices and grid instability.
FAQs
How do I choose the best demand response program for my plant?
To dive into demand response programs, begin by identifying your primary goals. Are you aiming to generate additional revenue, meet specific grid requirements, or something else? Once that's clear, evaluate how adaptable your facility is. Can you adjust or scale back certain processes during peak demand without disrupting daily operations? This flexibility is key.
Next, take a closer look at the different program types available - capacity, economic, and ancillary services. Each comes with its own set of requirements, such as varying response times, payment structures, and potential penalties. Understanding these differences will help you choose the right fit for your facility.
Lastly, reach out to your local utility provider. They can guide you through the programs and incentives specific to your region, ensuring you make the most of the opportunities available.
What loads can I curtail without hurting production or safety?
Industrial demand response programs target energy loads that can be adjusted without disrupting essential operations. These typically include heat storage-related processes like electrolytic aluminum production, electric arc furnaces, or polysilicon manufacturing. Other examples are non-critical processes and auxiliary systems such as HVAC or compressed air systems. The objective is to balance energy use by shifting, reducing, or modulating loads - keeping production efficient and the grid stable, all while prioritizing safety and productivity.
How can I prevent baseline disputes and rebound spikes after events?
To minimize disagreements about baselines, rely on standardized, verifiable methods for performance evaluation. Many utilities offer frameworks like calculated baselines that incorporate weather-based or symmetrical adjustments to improve accuracy.
To address rebound spikes, consider using automated demand response systems. These systems can include pre-programmed load reduction sequences, which help control the timing of load recovery. By doing so, they prevent sudden surges in electricity usage right after an event.