How to Estimate Costs for Power Networks
If you miss one cost bucket, your estimate can be off by thousands of dollars.
When I estimate a power network, I keep it simple: I price materials, labor, engineering and permits, job overhead, and contingency - then I check the result against unit benchmarks like $/kVA, $/mile, or $/kW-km.
Here’s the short version:
- I start with scope: new build, expansion, or upgrade
- I gather load, voltage, feeder lengths, equipment counts, and site conditions
- I split costs into direct and indirect buckets
- I price each line as quantity × unit cost
- I add contingency based on design uncertainty
- I compare the final number to benchmarks like $51/kVA, $87/kVA, and $112/kVA
- I update the estimate every time drawings, quotes, or route details change
A few cost facts stand out fast:
- Underground distribution can run around $200/kW-km
- Overhead distribution may be closer to $30–$100/kW-km
- A small miss - like grounding, CT cabinets, or a PVC-to-GRC transition - can change the budget in a hurry
What this means for you: a usable estimate is not just a material list. I need to tie pricing to the one-line, feeder routes, trench or pole work, equipment quotes, labor burden, and site rules before I trust the total.
Overhead vs. Underground Power Distribution: Cost Comparison Guide
Electrical Estimating - Complete Step-by-Step Guide
sbb-itb-501186b
Quick Comparison
| Area | What I include | What I watch closely |
|---|---|---|
| Direct costs | Conductors, conduit, ductbanks, transformers, switchgear, metering, grounding, installation labor | Missed fittings, feeder length changes, conductor type |
| Indirect costs | Project management, permits, insurance, legal, temp power, office overhead | Scope gaps and local rule changes |
| Cost model | Quantities, units, vendor quotes, labor rates, contingency | Unit mix-ups, stale quotes, weak takeoffs |
| Benchmarks | $/kVA, $/mile, $/kW-km | Wrong comparison basis |
| Topology choice | Overhead vs. underground | Trenching, concrete, poles, route access |
So if I want a solid early budget, I build it from the site facts first, not from a rough allowance.
2. Gather the Inputs Before You Estimate
Before you put a price on anything, pull all project data into one input sheet. That keeps the estimate complete and consistent. It also gives you the base for unit pricing and the cost breakdown in the next step.
2.1 Define Load, Voltage, and Network Layout
Start with demand. That means peak and average load, ampacity, future growth, and the primary and secondary voltage used by the system.
Then map the network layout. Use one-line diagrams to spot feeder routes, total feeder lengths in feet or miles, conduit types, and any parallel runs for large feeders. Record feeder lengths, conduit type, parallel runs, conductor type, and major equipment counts. That includes switchboards, panels, MCCs, metering gear, CT cabinets, breakers, and grounding parts.
"Estimating feeders, service, and distribution is more than pulling numbers from a schedule; it's a disciplined review of every component that carries, protects, and distributes power." - George Hatziyianis, 1-Degree
It also helps to cross-check feeder schedules against one-line and riser diagrams. That's often where missing items show up.
2.2 Site Conditions That Affect Cost
Site conditions can change the estimate before pricing even starts. Add soil type, trench depth, easement or right-of-way limits, utility interconnection needs, and local permitting rules to the input sheet.
Underground ductbanks bring extra excavation, formwork, and concrete. Above grade, EMT usually costs less. GRC fits exposed or high-damage areas better, and stainless steel makes sense in corrosive locations. Also flag transitions like PVC to GRC at grade, because they add labor and fittings.
Utility providers may require certain metering gear and CT cabinets too. Labor rates and utility rules can vary by region, and that can move costs in a big way. When you log these job-specific details early, the estimate stays tied to the actual site instead of a rough guess.
Use this checklist to keep the estimate complete.
| Input Category | Key Data Points to Collect |
|---|---|
| Load & Voltage | Peak/average kW/kVA, primary/secondary voltage, growth rate |
| Conductors & Conduit | Material (Cu/Al), insulation type (THHN/XHHW/RHW), parallel run counts, conduit type (EMT/GRC/PVC), total length in feet, ductbank details |
| Equipment | Switchboards, panels, MCCs, metering gear, CT cabinets, breakers, mounting type |
| Grounding | Rods, foundation electrodes, bonding conductors, exothermic welds |
| Site Conditions | Soil type, trench depth, corrosive/hazardous environment status, ROW limits |
With the inputs captured, the estimate can be split into equipment, labor, indirects, and contingency.
3. Break the Estimate Into Cost Components
Once you have the inputs, sort them into pricing buckets so you can build the estimate line by line. That keeps the math clean and makes it much easier to see where the money is going.
3.1 Equipment and Infrastructure Costs
Start with direct equipment and infrastructure items, and list them on their own. This bucket includes conductors, conduit, ductbanks, poles, transformers, switchgear, and other electrical equipment.
Give grounding its own line item. It often gets missed in early budgets, and that can throw off the estimate later. Do the same for transition fittings and the labor tied to them. They may look small on paper, but they show up again and again and can add up fast.
For major equipment, use vendor quotes where you can, especially for switchboards, MCCs, and metering gear. Aluminum is often cheaper than copper, but code rules and the job’s use case still set the limits.
Once material pricing is in place, add labor and overhead to get the installed cost.
3.2 Labor, Engineering, Indirects, and Losses
Labor should cover more than the field crew. It also includes payroll taxes, insurance, and benefits. Put engineering, project management, permits, temporary facilities, utilities, and office overhead under indirect costs.
If you’re also estimating operating cost, show technical losses as a separate line item. Don’t mix an operating-loss allowance into the construction estimate. That’s an easy way to blur two different cost buckets.
3.3 Overhead vs. Underground Distribution: Budget Comparison
Network topology can shift the estimate just as much as material choice, especially when you’re comparing overhead and underground systems.
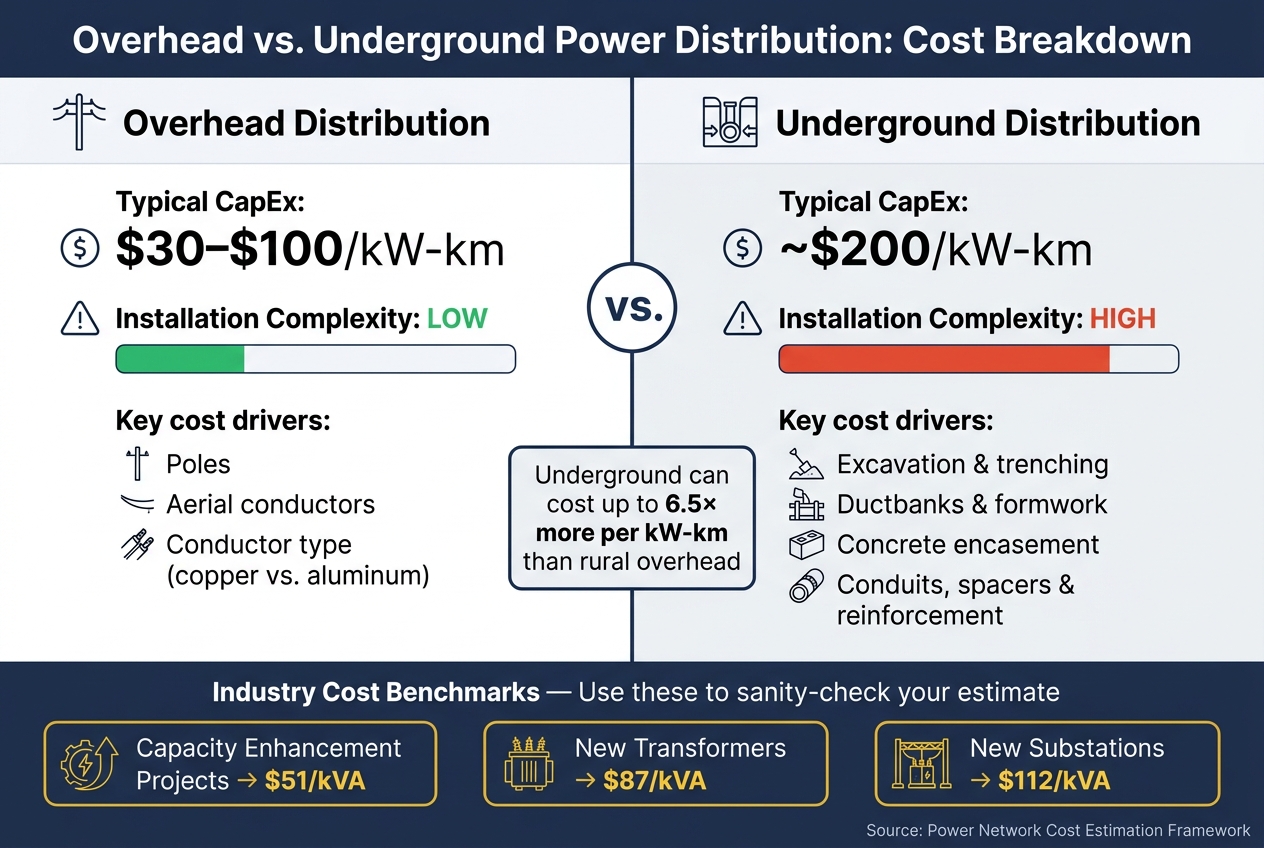
The gap can be big. Overhead layouts usually cost much less because they avoid trenching, ductbanks, and concrete work. Underground systems run at about $200/kW-km, compared with about $30/kW-km for rural overhead and $100/kW-km for urban overhead.
Here’s the budget picture at a glance:
| Cost Driver | Overhead Distribution | Underground Distribution |
|---|---|---|
| Typical Capex | $30–$100/kW-km | ~$200/kW-km |
| Installation Complexity | Lower; involves poles and aerial conductors. | Higher; requires excavation, ductbanks, formwork, and concrete encasement. |
| Primary Material Cost Drivers | Poles, conductors, and conductor type (copper vs. aluminum). | Conduits, ductbanks, concrete, spacers, and reinforcement. |
4. Build the Cost Model Step by Step
Once your cost buckets are set, turn them into a spreadsheet model. The goal is simple: build the estimate in a clear sequence so each number has a place and a reason behind it. A dependable estimate usually follows this path: define the project scope, break the work into tasks, gather pricing and labor data, estimate indirect costs, add contingency, and then check the result against actual costs. Use the same buckets from Section 3 and fill in the sheet line by line.
4.1 Assign Quantities, Units, and Unit Costs
Start with quantities from construction drawings and takeoffs. Pull conductor lengths, conduit runs, elbows, and transitions straight from the plans. Size transformers in kVA, and count big-ticket items like panels and breakers one by one.
Keep your units consistent. That might mean using $/mile, $/foot, $/kVA, or $/kW-km. If the design shifts later - and it usually does - you'll be able to compare numbers without making a mess of the model .
For pricing, use vendor quotes first. If you don't have a quote for a line item yet, plug the gap with past project data or benchmark figures.
4.2 Calculate Direct Costs, Indirect Costs, and Contingency
For each line, calculate cost as quantity × unit cost. Do that for both material and labor. Labor should use a burdened rate, not just base pay. That means wages, taxes, insurance, and benefits all need to be rolled in.
From there, add up the line items into your direct cost subtotal. Then layer in indirect costs, such as:
- Project management
- Permits
- Insurance
- Legal
- Utilities
- Overhead
After that, add contingency as a percentage of the subtotal. The right percentage depends on how far along the design is and how much uncertainty is still sitting in the estimate.
The table below lays out a simple three-scenario setup and the main variables to watch:
| Scenario | Labor Rate Assumption | Equipment Pricing | Contingency |
|---|---|---|---|
| Low | Favorable market rates | Current vendor quotes | Lower contingency |
| Base | Burdened rate (wages + taxes + benefits) | Quotes with a modest escalation buffer | Moderate contingency |
| High | Elevated rates with overtime risk | Quotes with a larger escalation buffer | Higher contingency |
Contingency should shrink as the design gets more defined and more assumptions are replaced by vendor quotes. At the concept stage, a wider range makes sense. With a detailed design and confirmed equipment selections, the percentage should move lower.
4.3 Check the Estimate Against Benchmarks
Before you lock anything in, do a quick sanity check. Compare your total cost per mile or per kVA against known benchmarks. Just make sure you're matching the same project type and the same unit. Otherwise, you're comparing apples to oranges.
Capacity enhancement projects have historically averaged $51/kVA, while new substations are closer to $112/kVA and new transformers come in around $87/kVA. If your estimate lands outside those ranges, track down the assumption behind the gap. That's often the part of the model that needs sensitivity testing next.
5. Refine and Maintain the Estimate
Treat the estimate like a living document. As new drawings, quotes, and site data come in, the numbers should change too.
Once you’ve benchmarked the base estimate, put the main assumptions under pressure. That’s where weak spots usually show up.
5.1 Run Sensitivity Checks and Design Revisions
Small changes can hit the estimate harder than people expect. If load grows, you may need larger conductors or parallel runs. If routes get longer, both material and labor go up.
| Variable | Impact on Estimate | Mitigation Strategy |
|---|---|---|
| Load Growth | May require larger conductors or parallel runs | Re-evaluate feeder schedules and conduit capacity |
| Route Length | Increases material quantities and labor hours | Perform detailed quantity takeoffs from updated drawings |
| Labor Rates | Affects total project cost | Use historical benchmarks and current labor data |
| Underground Shift | Raises install cost | Price both route options before final layout |
| Market Volatility | Rapidly changes material pricing | Use escalation buffers and refreshed vendor quotes |
Before you lock in procurement assumptions, make sure the cheaper option still meets spec. A lower number on paper doesn’t help if it creates a compliance problem later.
When labor rates, material prices, or site conditions are uncertain, use scenario analysis or Monte Carlo modeling to show a cost range instead of one fixed number. That gives the team a better sense of risk and keeps the estimate tied to what might happen in the field.
5.2 Document Assumptions, Sources, and Update Dates
After each revision, record what changed and why. Sounds basic, but this step saves a lot of pain later.
Log every assumption: quote date, drawing revision, conductor spec, and regional adjustment factor. Without that trail, the estimate gets hard to defend and even harder to update cleanly.
If pricing comes from Electrical Trader listings, log the listing date and item details. Prices move, and an undated quote can quietly throw the estimate off without anyone catching it.
Keep the estimate file easy to update as bids, drawings, and site data change.
FAQs
How accurate is an early power network estimate?
Early power network estimates come with a lot of uncertainty. At that stage, the project scope is still taking shape, design details are thin, and site data is often limited. Because of that, conceptual estimates - often called AACE Class 5 - can swing quite a bit, sometimes from -25% to +50% or more.
As planning, scoping, and design move forward, those ranges usually tighten. With more mature estimates, such as Class 3, accuracy often improves to about -20% to +30%. That tends to happen when the estimate is backed by historical data, data-driven modeling, and detailed cost breakdowns.
What costs are often missed?
Estimators often miss small but critical requirements tucked into project notes or detail drawings. Things like conduit transitions or grounding components can slip by, and those misses can throw off the whole number.
A few other costs get left out all the time too: insurance, permit and inspection fees, legal expenses, temporary facilities, full labor needs for work like exothermic welding or routing, equipment rentals, and contingency for scope changes and inflation.
When should I choose overhead vs. underground?
Choose based on the tradeoff between upfront construction cost and long-term upkeep.
Overhead lines usually cost less to build, are easier to change, and can often be repaired faster. Underground lines are better shielded from weather-related outages and wildfire risk, and they often come with lower day-to-day maintenance plus a cleaner look.
The right choice depends on more than the price tag on day one. Look at lifecycle costs, reliability data, and site limits such as terrain, access, and hazards in the surrounding area.