

Digital Twin Data for Generator Fault Prediction
A generator usually fails in stages, not all at once. If you track the right signals early, you can spot trouble before it turns into downtime, overtime labor, and rush part orders.
Here’s the short version: I’d use a digital twin to compare live generator data against normal machine behavior, then act on slow drift in vibration, temperature, current balance, cooling performance, and oil condition. That matters because 61% of manufacturers reported unplanned downtime in the prior year, and losses reached up to $852 million per week across the surveyed sector.
If I had to boil the article down, it comes to this:
- Watch the fault signs that show up first: stator insulation issues, rotor winding faults, bearing wear, shaft misalignment or unbalance, and cooling system trouble.
- Use the core data first: vibration, winding and bearing temperatures, and electrical readings.
- Judge change in context: compare signals against load, speed, and ambient conditions, not fixed limits alone.
- Look for drift, not one-off spikes: a trend over days or weeks matters more than a short event during startup or shutdown.
- Tie alerts to action: inspection, outage timing, work order, and parts request.
- Match replacement parts to the machine and model: if hardware changes, update the twin before startup.
A few numbers stand out:
- A 10°F to 15°F rise above normal winding temperature at similar load can point to heat or insulation trouble.
- Phase current imbalance moving from under 1%–2% to 3%–5% can warn of electrical issues.
- In hydrogen-cooled units, purity below 96% for 30 minutes is a warning sign.
- Bearing data can give weeks to months of notice before failure in monitored systems.
| What to track | What it can point to | What to do next |
|---|---|---|
| Rising 1× vibration | Unbalance or misalignment | Inspect rotor, alignment, base, and supports |
| Bearing defect frequency peaks | Bearing wear or lube trouble | Plan bearing change, seal work, and oil service |
| Higher winding temp at same load | Insulation or cooling trouble | Check cooling path, RTDs, load, and winding condition |
| Current imbalance trend | Loose connection or winding fault | Test connections, relays, and winding health |
| Cooling performance drift | Fouled filters, ducts, fans, or water path | Clean, repair, and verify airflow or water flow |
That’s the whole point of the article: use machine data early enough to move from emergency repair to scheduled work and planned purchasing.
How Digital Twins Predict Machine Failures Before They Happen
sbb-itb-501186b
Common Generator Failure Signs and the Data Behind Them
The clearest early warning signs tend to fall into a handful of repeat fault modes. Each one leaves its own data trail. The twin compares those trails against load, speed, and temperature, so it needs both the fault signal and the operating context that makes the signal meaningful.
Failure Signs Teams Can Track Before a Breakdown
Teams should watch five main fault types in industrial and utility-scale generators: stator insulation degradation, rotor winding faults, bearing wear, shaft misalignment or unbalance, and cooling system problems. These are common warning signs ahead of forced outages.
Stator insulation degradation usually shows up as rising PD, higher winding temperature at the same load, and lower insulation resistance. A 10°C end-turn phase delta is an action-level alert.
Rotor winding faults are harder to spot at first. Even a short involving as few as 2 turns in a rotor winding can be detected by analyzing negative-sequence currents at the generator terminals and the matching double-frequency currents in the field winding. These electrical imbalances often show up alongside higher 1× running-speed vibration, which gives teams two signals they can compare side by side.
Bearing wear tends to surface through slowly growing spectral peaks at bearing defect frequencies, rising bearing temperatures at normal load, and oil condition changes, such as higher metal particle counts, moisture, or viscosity shifts. In plants with continuous monitoring, these signs often give teams weeks to months of warning before a bearing reaches a critical state.
Shaft misalignment and unbalance follow a similar pattern, but the vibration signature is different. Unbalance usually appears as higher 1× vibration that scales with speed. Misalignment often shows up through notable 2× running-speed components, especially in the axial direction.
Cooling system problems usually build over time instead of hitting all at once. In hydrogen-cooled generators, a hydrogen purity drop below 96% sustained for 30 minutes, or a makeup rate above 15 ft³/hr over 8 hours, points to a problem that needs attention before winding temperatures start to climb. In stator water-cooled systems, conductivity above 2.0 µS/cm signals contamination that cuts cooling performance and speeds up insulation aging. Winding RTDs often show the downstream effect: a slow, steady temperature rise at the same operating load.
Data Sources Used to Build a Generator Digital Twin
A digital twin is only as good as its inputs. The table below shows the core data streams teams use, grouped by what they measure and why they matter.
| Data Source | What It Measures | Primary Fault Modes Supported |
|---|---|---|
| Vibration probes / accelerometers | Bearing defect frequencies, 1× and 2× harmonics, overall RMS | Bearing wear, misalignment, unbalance |
| RTDs and thermocouples | Stator winding, core, bearing, and coolant temperatures | Insulation degradation, cooling failures, bearing wear |
| Current and voltage measurements | Phase currents, voltages, power factor, negative-sequence components, harmonics | Rotor winding faults, stator faults, excitation issues |
| Shaft speed / phase reference | Running speed, harmonic order identification | Misalignment, unbalance, rotor asymmetry |
| Oil condition data | Particle counts, viscosity, moisture, oxidation | Bearing wear, lubrication failure |
| SCADA / DCS historian trends | Load, alarms, trips, and operating context | Baseline comparison and event correlation |
| Protection relay events | Overcurrent, differential, negative-sequence, ground fault records | Rotor and stator faults |
| Excitation system data | Field current, rotor temperature, limiter actions | Rotor winding faults, loss of excitation |
| Maintenance history and inspection records | Work orders, repair notes, photos, and test results | Model validation, threshold calibration, failure-pattern learning |
| Nameplate and design data | Ratings, insulation class, cooling type, winding design | Baseline modeling, safe operating limits |
If the budget is tight, start with vibration monitoring, winding and bearing temperatures, and electrical measurements. Those streams give the clearest view into the main failure modes, and they can often plug into an existing SCADA or DCS setup. Oil analysis and online PD monitoring are strong add-ons for larger, higher-consequence units where the risk justifies the extra spend.
Maintenance history and inspection records are easy to brush aside, but they matter more than many teams expect. When the twin compares sensor trends with past repair history, it can learn patterns that improve remaining-useful-life estimates and cut false alarms. That’s how teams start separating normal drift from fault risk.
How a Digital Twin Detects Faults Earlier Than Fixed Maintenance Schedules
Once those signals are in place, the twin moves maintenance away from a calendar and toward the machine’s actual condition. A fixed schedule treats every generator the same. A digital twin doesn’t. It checks live behavior against a baseline that already accounts for load and ambient conditions, then spots drift before that drift turns into a fault.
That’s where the big difference shows up: the alerts are specific. Instead of a generic service reminder, the twin can flag something like a bearing running hotter than it should at the current load, or 1× running-speed vibration inching above its baseline over a period of weeks. That gives the maintenance team something concrete to inspect and fix.
From Raw Sensor Data to Usable Condition Indicators
Raw sensor data is messy. It comes in at different speeds, includes noise, and doesn’t say much by itself. A 10 kHz vibration stream and a 1-second SCADA temperature update need to be lined up and cleaned before anyone can trust the analysis.
The first step is time alignment. All incoming streams are synchronized to a common time base, and small gaps are interpolated. After that, digital filters remove noise that doesn’t matter while keeping the frequency bands that do, such as 1× running-speed for unbalance or bearing defect frequencies for wear detection. Temperatures are converted into temperature rise above ambient in °F instead of raw values, and electrical readings such as current imbalance are normalized as a percentage of the nominal phase average.
When the data is clean and aligned, the twin pulls out condition indicators such as band-limited vibration amplitudes, temperature rise per kW of load, current imbalance percentage, and thermal loading trends. These are the values engineers and planners can actually use. A thermal loading trend that keeps drifting upward at the same operating load tells a much clearer story than a single temperature reading on its own.
Warning Thresholds That Separate Normal Drift From Real Fault Risk
A digital twin builds adaptive baselines from the generator’s own healthy-state history. In plain English, it learns what normal looks like across load bands, ambient temperatures, and operating modes. Early warning levels are usually set at modest statistical departures from those baselines, such as crossing 2 standard deviations from the learned mean for a sustained period. Alert and critical levels reflect stronger or faster departures.
Those outputs only help if the team knows which changes matter and how long they need to last. The table below links common condition indicators with the threshold patterns teams usually watch for and the fault types they may point to.
| Indicator | Early warning behavior | Alert / critical behavior | Likely fault type |
|---|---|---|---|
| 1× running-speed vibration | Gradual increase of 20–40% above baseline over several weeks at similar load | Sustained >70% above baseline or rapid step-change; spikes during startup, shutdown, or load changes | Rotor unbalance, misalignment, soft foot, foundation degradation |
| High-frequency vibration (bearing defect band) | Emerging peaks at bearing defect frequencies slightly above noise floor; increasing trend in envelope spectra | Strong, stable peaks at defect frequencies with harmonics; rising overall bearing RMS | Rolling-element bearing wear, surface spalling, lubrication failure |
| Winding temperature rise above ambient (°F) | Temperature rise drifting 5–10 °F above historical values at same load and ambient | Persistent >15 °F above baseline under typical load; fast rise after load increase | Insulation degradation, cooling path blockage, overloading, fouled heat exchangers |
| Current imbalance (%) across phases | Imbalance creeping from <1–2% baseline to 3–5% under similar load | Sustained >5% or steadily increasing trend independent of operational changes | Loose connections, unequal phase loading, partial winding short, connector corrosion |
| Thermal loading trend (temp rise per kW) | Slight upward drift in temperature-per-kW ratio over months, especially during high ambient periods | Sharp or step-change increase in temperature-per-kW ratio with cooling system operation unchanged | Cooling system degradation, fouled air or water paths, undersized ventilation |
The main thing to watch is duration and rate of change, not just size. Short spikes during startup or shutdown are normal. Sustained drift across operating cycles is not. When that kind of drift shows up, it should trigger a work order, not just another alarm.
Once the twin flags sustained drift, the next step is turning that alert into a repair plan and parts order.
Turning Model Output Into Repair Plans and Parts Orders
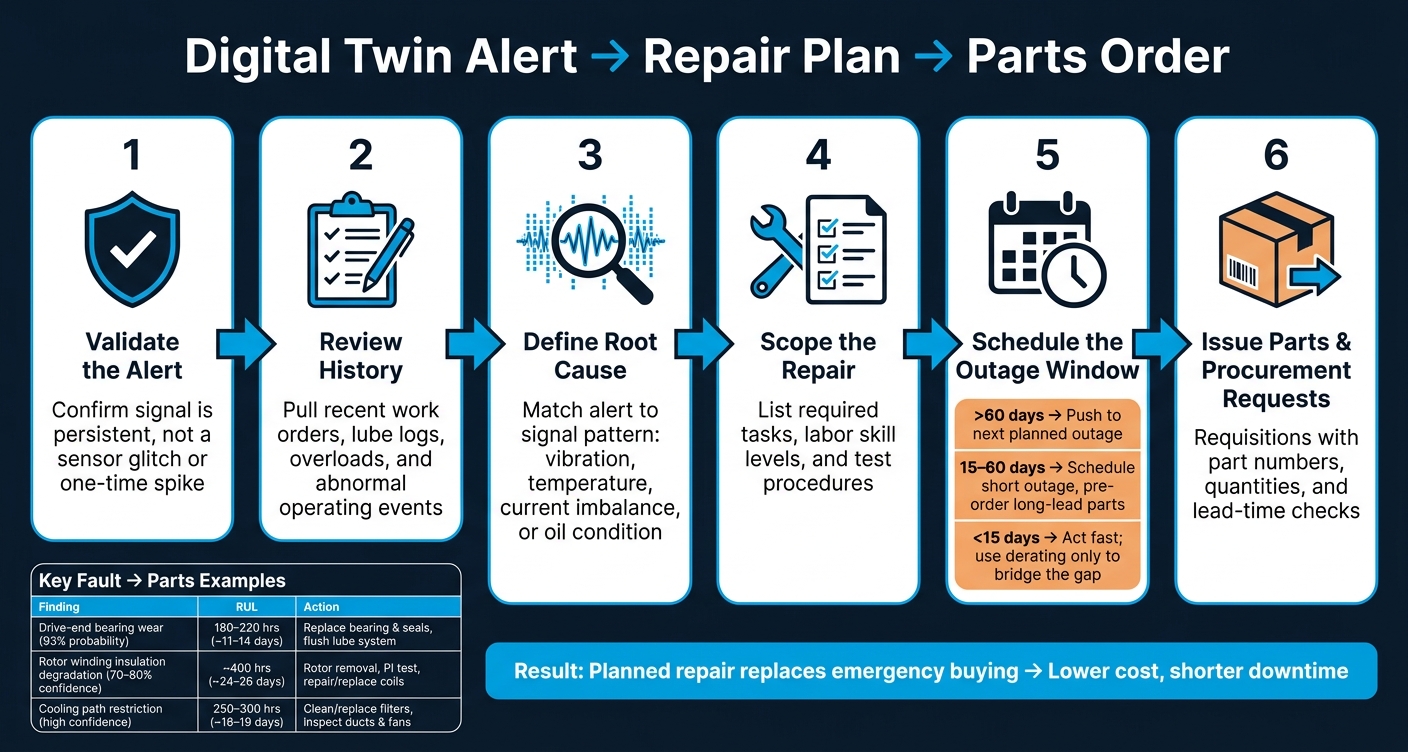
Digital Twin Generator Fault Prediction: From Data to Repair
Once the twin flags a likely fault, the next job is to turn that alert into action. An alert on its own doesn't fix anything. It only starts to matter when it turns into a work order, an outage window, and a parts request. Use the model's health score, fault class, confidence, and RUL to decide whether the right move is an inspection, a scheduled repair, or a full replacement.
A Clear Workflow for Maintenance, Scheduling, and Procurement
The strongest workflows follow a set sequence instead of leaving each alert up for debate.
- Validate the alert: Check that the signal is valid and persistent, not a sensor glitch or a one-time spike.
- Review history: Pull recent work orders, lubrication logs, overloads, and abnormal operating events.
- Define the root cause: Match the alert to the signal pattern that triggered it, such as vibration, temperature, current imbalance, or oil condition, and cross-check it with known failure patterns on the unit or across the fleet.
- Scope the repair: List the required tasks, labor skill levels, and test procedures. A bearing fault means disassembly, bearing and seal replacement, a lubrication flush, and a post-repair vibration check. A cooling path restriction means cleaning or replacing filters, inspecting ducts and fans, and confirming airflow.
- Schedule the outage window: If RUL is more than 60 days, push the work to the next planned outage. At 15–60 days, schedule a short outage and pre-order long-lead parts. Under 15 days, move fast and use derating only to bridge the gap.
- Issue parts and procurement requests: Maintenance and supply-chain teams issue requisitions with part numbers, quantities, and lead-time checks.
With the repair scope in place, procurement can line up parts with the outage window instead of scrambling at the last minute.
Planning Spares and Replacement Equipment Without Emergency Buying
Emergency buying costs more, and in many cases, it can be avoided. If the digital twin keeps flagging early-stage wear on bearings, insulation, or cooling parts across a fleet, planners can spot the pattern early and add those items to on-site stock before the problem turns urgent.
A simple way to think about it: sort parts by outage risk and lead time. If a failed part could keep a generator down for a long stretch and replacement lead times are long, keep at least one unit on-site when RUL points to a realistic failure risk in the next 6 to 12 months. Standard consumables like filters and fasteners usually don't need on-site stock. Planned orders triggered by the model are often enough. This tiered approach keeps inventory costs in check while lowering the odds that a generator sits idle because one key part isn't there.
That shifts part sourcing from fire-drill mode to planned work.
The table below shows how digital twin findings turn into repair plans and procurement timing, using 16 operating hours per day.
| Digital Twin Finding | Likely Root Cause | Repair Action | Required Parts | Earliest Completion | Latest Completion |
|---|---|---|---|---|---|
| Drive-end bearing wear; health score 0.62; bearing fault probability 93%; RUL 180–220 hours | Drive-end bearing wear, lubrication degradation | Replace bearing and seals; flush and refill lubrication system; post-repair vibration test | Bearing set, seal kit, ISO VG 68 lubricant, mounting hardware | ~11–12 days from detection | ~13–14 days from detection |
| Rotor winding insulation degradation; moderate confidence (70%–80%); RUL about 400 hours | Rotor winding insulation degradation | Rotor removal; PI insulation test; repair or replace damaged coils | Insulation tape, varnish, coil materials, fasteners | ~24 days from detection | ~26 days from detection |
| Cooling path restriction; high confidence; RUL 250–300 hours | Blocked air or water cooling path | Clean or replace filters; inspect ducts and fans; verify airflow | Replacement filters, fan blades or motor, ductwork hardware | ~16 days from detection | ~19 days from detection |
Planned repairs cost less than reactive work because they avoid premium freight and long outage time.
Once the repair scope is set, the next move is to source the right parts before the outage starts.
Sourcing the Right Components to Support Predictive Maintenance
Once the repair scope is clear, sourcing turns into a spec-matching job. A digital twin stays useful only if the replacement hardware lines up with the assumptions built into the model. If a part doesn’t match the original setup, prediction accuracy can slip - and the system may not give you any clear warning that it happened.
Match each replacement part to the generator’s nameplate ratings. Check voltage, current, 60 Hz frequency, interrupting rating, insulation class, and NEMA enclosure type. For sensors, confirm accuracy class, measurement range, and response time. A temperature sensor that reads a little off can weaken fault detection without setting off an alarm. And if a replacement changes trip settings or impedance, update the twin before startup.
The parts worth stocking first are the ones that affect detection and protection behavior:
- Vibration sensors
- RTDs and thermocouples
- Current and voltage transformers
- Protective relays
- Circuit breakers
Where Electrical Trader Fits in a Predictive Maintenance Workflow

Once critical spares are identified, the next move is lining up a supply channel you can count on. When the digital twin spots a developing fault before a planned outage, the maintenance team gets time to source parts with care instead of scrambling at the last minute. Electrical Trader fits into that workflow by offering both new and used electrical components and power generation equipment - including breakers, transformers, and related gear. That range matters when OEM lead times stretch out or a specific part is no longer made.
Mission-critical standby generators should use new or manufacturer-refurbished protection devices with documented test results and traceable history. For non-critical or redundant assets, tested used components can make sense for some items if they match the original ratings. The key is simple: have a sourcing channel in place before the digital twin sends up a flag. That’s what helps planned maintenance stay planned instead of turning into emergency buying.
Conclusion: Use Digital Twin Data to Cut Downtime and Improve Parts Planning
Common generator faults can be measured early, and that early signal changes both repair timing and parts planning. Bearing wear, insulation degradation, cooling restrictions, and protection issues all leave signs well before a forced outage. A digital twin that pulls together vibration, thermal, electrical, and oil-condition data into one health model can spot those signs earlier than fixed maintenance schedules can.
Adaptive thresholds cut down the noise that makes fixed-limit alerts so frustrating. When model output ties straight to inspection scope, outage timing, and parts procurement, fault prediction starts leading to actual cost savings. Keep the twin updated when hardware changes. If not, its alerts drift out of sync with the machine it’s supposed to track. When each part of the process stays aligned, the chain holds: accurate data → valid thresholds → correct parts → planned repair. Correctly rated parts keep the twin’s alerts and protection settings aligned with the real system.
FAQs
What is a digital twin for a generator?
A digital twin for a generator is a live virtual copy of the physical asset. It updates all the time with real-time sensor data, engineering simulations, and machine learning.
That’s what sets it apart from basic monitoring with fixed alarms. Instead of waiting for a reading to cross a set limit, it models how the generator should normally behave and flags small performance shifts early.
It also brings together SCADA, condition-monitoring, and historical data to forecast equipment health and remaining useful life.
Which generator faults can a digital twin catch first?
Digital twins often spot subtle generator faults first. They do this by picking up small performance drifts and odd data patterns before fixed alarms go off.
Early signs can include:
- Mechanical issues like rising vibration, shaft misalignment, or bearing wear
- Electrical faults such as partial discharge, insulation degradation, and winding faults
- Thermal trends like unusual heating or temperature changes
How do digital twin alerts become repair and parts plans?
Digital twin alerts can turn into repair plans and parts orders when they connect to CMMS or EAM platforms. Once the twin spots an anomaly, it can open a work request that includes the asset ID, the likely failure mode, and the tasks the team should take.
From there, a reliability engineer checks the data to confirm the fault. Then a planner lines up the labor and the parts. The predicted failure window makes this much easier to time. It helps teams order parts early enough to match supplier lead times, without piling up extra inventory and driving up carrying costs.