

Digital Twin Analytics for Power Plant Maintenance
A digital twin can cut downtime, lower maintenance cost, and help you act before equipment fails. In the article, I show that the biggest gains come from four steps: connect plant data, set clear triggers, push alerts into CMMS work orders, and line up parts before a failure stops generation.
Here’s the short version:
- I use SCADA, historians, condition sensors, and CMMS/EAM records to build the twin.
- I focus on critical assets first like turbines, boilers, transformers, pumps, and major fans.
- I set triggers in three ways: fixed limits, abnormal behavior, and remaining useful life.
- I turn alerts into reviewed work orders with asset ID, failure mode, tasks, labor needs, and parts.
- I use the same risk signal to guide spare-parts timing, stock levels, and repair vs. replace decisions.
- I track results with hard numbers like unplanned outage hours, maintenance cost per MWh, inventory turns, and stockout rate.
A few numbers stand out. One study in the article reports downtime dropping from 18.4 hours to 9.7 hours per month, a 47.3% cut. The same study shows maintenance cost falling from $4,950 to $3,420 per month, or 30.9% less. More broadly, predictive and condition-based programs can cut unplanned downtime by 30% to 50% and maintenance costs by 18% to 25%.
What matters most is not the model alone. If alerts stay on a dashboard, nothing changes. You need clean data, clear asset IDs, rules that fit plant modes, and a CMMS flow that turns alerts into field work.
Quick comparison
| Area | Time-based approach | Digital twin approach |
|---|---|---|
| Maintenance timing | Fixed calendar or run hours | Based on condition, risk, and life left |
| Failure detection | Often after symptoms are obvious | Earlier warning from pattern shifts and wear trends |
| Work orders | Manual planning | Alert-driven draft requests with context |
| Spare parts | Stock by OEM list and history | Stock by predicted failure window and lead time |
| Downtime impact | More chance of forced outages between PMs | Lower outage risk when work is moved into planned windows |
| Main data used | PM schedule and past jobs | SCADA, sensors, historians, and CMMS together |
If you want twin analytics to help plant maintenance, this is the path I’d follow: start with 3 to 5 critical assets, clean the data, define triggers, connect to CMMS, and measure outage and cost results.
The Digital Twin: Revolutionizing Plant Maintenance via Real-Time Simulation 🏢🤖
sbb-itb-501186b
Build the Data Foundation for a Maintenance Twin
Next, connect SCADA, sensors, historians, and CMMS records. A maintenance twin is only as good as the data behind it. If the data is clean and lined up, the twin can turn raw signals into maintenance calls that make sense.
Core Data Sources: SCADA, Historians, Sensors, and CMMS
At a minimum, a power plant maintenance twin needs data from four areas:
- SCADA/DCS/PLC systems provide real-time operating data like pressure, temperature, flow, load, valve position, breaker status, and equipment start/stop state for assets such as turbines, boilers, generators, pumps, and fans. Each measurement should be available as a tag, with engineering units and a clear tie to one asset.
- Condition-monitoring sensors fill in the health side of the picture that process data alone can miss. That includes vibration spectra, bearing defect frequencies, oil contamination, thermal hot spots, and partial discharge readings. These may come from edge devices or IIoT sensors that stream into a collector before the data reaches the twin.
- Plant historians keep long-term time-series data at high resolution. That history gives anomaly detection and remaining-life models enough context to learn seasonal patterns, load cycles, startup and shutdown behavior, and past events outside normal operating ranges.
- CMMS/EAM platforms add work order history, failure codes, labor hours, parts used, and asset-level cost data. This is what ties operating conditions to maintenance results.
Start with the most critical assets first: gas and steam turbines, boilers, main transformers, boiler feed pumps, cooling water pumps, and major fans. Those assets usually drive the biggest share of lost megawatt-hours and unplanned spending.
Data Quality, Asset IDs, and Model Accuracy
Hooking up the four data sources is only the first step. The harder part is making sure the data can be trusted. That’s where many twin efforts get off track.
Common issues include sensor drift, poor calibration, stuck values, missing values caused by network gaps or historian setup errors, wrong engineering units, and timestamp mismatches across SCADA, historian, and CMMS servers. Any one of these can lead to false alarms or bad remaining-life estimates.
Asset naming matters just as much. Every historian tag and CMMS record should point back to the same asset ID. For example, GT1_BRG2_TEMP needs to map cleanly to Gas Turbine 1, Bearing 2, in both the historian and the CMMS work order system. If that link breaks, the twin can’t reliably connect operating data with maintenance history, and models may learn from failures tied to the wrong asset.
One simple but useful practice is to keep a central tag dictionary: a table that lists each tag, its asset ID, and its engineering units. Add automated data quality checks for zero-variance tags, out-of-range values, and timestamp gaps on critical signals. That helps catch problems before they pollute model training.
Security and Compliance for U.S. Plant Environments
In U.S. power plants that are part of the Bulk Electric System, NERC CIP rules shape how data moves between OT and IT. Use network segmentation and controlled one-way data transfer through firewalls, data diodes, or secure gateways. Access to twin dashboards and source data should use role-based access control, so each person, whether an operator, reliability engineer, planner, or data scientist, gets only the access needed for the job.
NERC CIP-015-1, approved by FERC in 2025, adds a direct requirement for internal network security monitoring inside Electronic Security Perimeters. It requires entities to detect and evaluate anomalous internal network activity, keep relevant monitoring data until investigations are done, and protect that data from unauthorized changes.
Once the data is mapped and checked, the next move is to define which conditions should trigger maintenance.
Set Maintenance Triggers and Compare Predictive vs. Time-Based Work
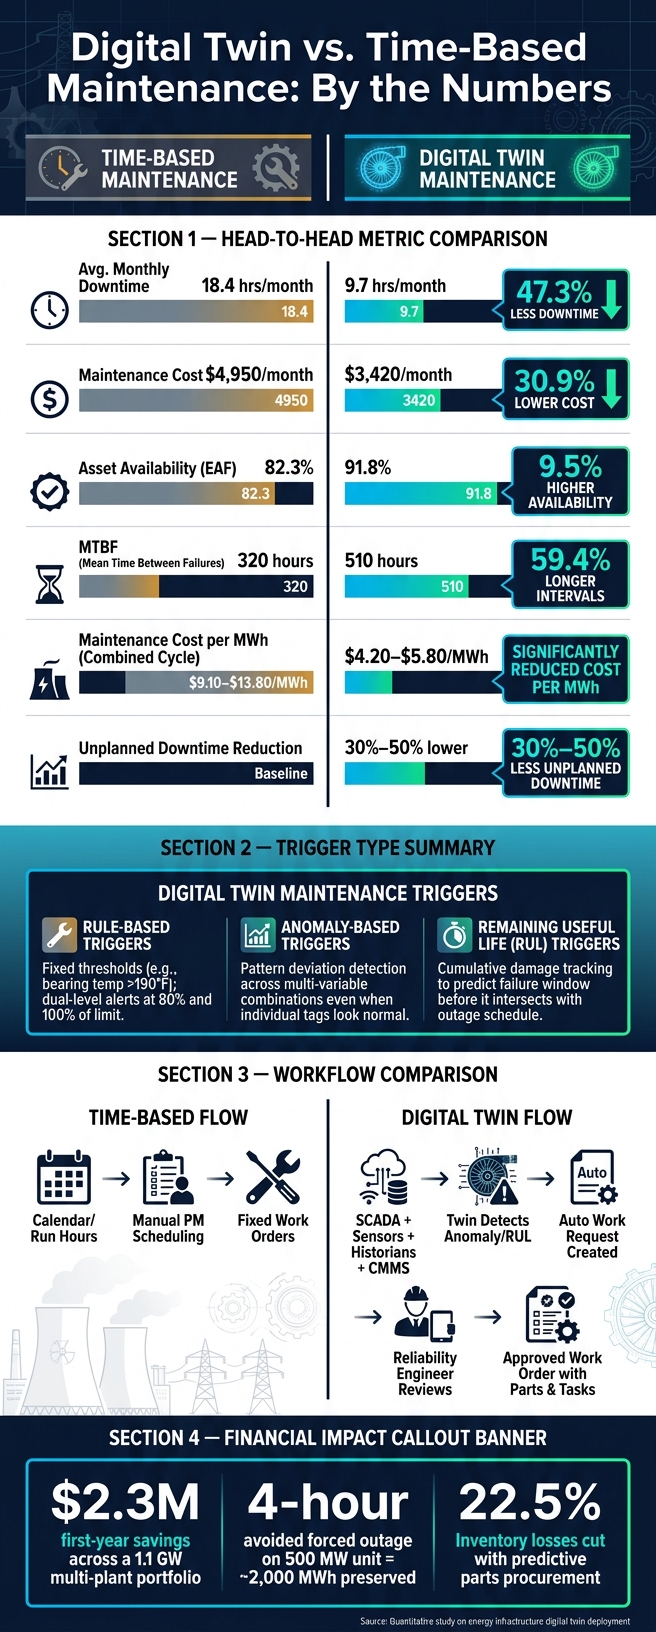
Digital Twin vs. Time-Based Power Plant Maintenance: Key Metrics Compared
Once the data foundation is in place, the next step is simple to say but harder to get right: decide when the twin should trigger action and how that trigger turns into maintenance work.
At this stage, teams usually choose between three paths. The twin can trigger on fixed limits, abnormal patterns, or predicted remaining life.
Rule-Based, Anomaly-Based, and Remaining-Life Triggers
Rule-based triggers are the easiest place to start. They fire when a measured value crosses a fixed threshold. Picture a gas turbine bearing metal temperature staying above 190°F. That signal gives crews time to line up an inspection before a forced outage. Many plants use two thresholds:
- An alert at about 80% of the limit
- An alarm close to the actual limit
Plants also use persistence logic and mode filters so startup and shutdown swings don't flood the team with noise.
Fixed thresholds catch the obvious stuff. Anomaly models catch the slower, sneakier problems.
Anomaly-based triggers take the next step. The twin learns what normal looks like across different loads and operating modes. Then it flags variable combinations that no longer fit that normal pattern, even if each individual tag still looks fine on its own.
A boiler is a good example. Steam flow might look normal. Flue gas oxygen might look normal too. But the relationship between furnace exit gas temperature and steam output may shift in a way the model has never seen during healthy operation. That's where anomaly detection helps most: assets can drift for a long time without ever tripping a hard limit.
When planners need more lead time, remaining-life estimates start to matter.
Remaining useful life (RUL) triggers look furthest ahead. The twin tracks cumulative damage such as operating hours, cycles, and peak temperatures to estimate when failure is likely. A model might flag a blade inspection or transformer intervention before remaining life drops below the available outage window. That gives planners room to fit the work into a scheduled outage instead of scrambling after a failure.
How Alerts Become Approved Maintenance Actions
Detection only matters if it lands in the maintenance system and turns into work people can act on.
A trigger should move fast into CMMS/EAM. The twin checks the signal against load, startups, and related tags. Then it creates a work request with the asset ID, trigger type, likely failure mode, and a recommended action. From there, a reliability engineer reviews it, a planner checks labor and parts, and a supervisor turns it into a scheduled work order. After the job is done, technicians close it in CMMS/EAM, and that feedback goes back into the twin to sharpen later detections.
This human check is a big deal. It keeps false positives from clogging the work order queue while still giving the plant the speed of automated detection. At that point, twin analytics stops being just a dashboard and starts acting like a maintenance process.
Comparison Table: Time-Based vs. Digital-Twin-Driven Maintenance
The gap between time-based work and twin-driven work shows up where operators feel it most: downtime, labor, parts, and cost.
One quantitative study on energy infrastructure assets found that digital twin-enabled predictive maintenance cut average downtime from 18.4 hours to 9.7 hours per month, a 47.3% reduction. In the same study, asset availability climbed from 82.3% to 91.8%, MTBF improved from 320 to 510 hours, and maintenance costs fell from $4,950 to $3,420 per month, or about a 30.9% reduction.
| Dimension | Time-Based Maintenance | Digital Twin Maintenance |
|---|---|---|
| Downtime | Scheduled around fixed intervals; unplanned failures still occur between PMs | Maintenance timed to condition; avg. downtime reduced ~47% in documented studies |
| Labor planning | Crews allocated by calendar-based PMs | Dynamic scheduling based on risk scores and outage windows |
| Parts usage | Stocked by OEM lists and historical usage patterns | Specific bearings, seals, or blades ordered ahead of expected need |
| Risk of missed failures | Higher - failures between PM intervals can go undetected until symptoms are obvious | Lower - anomaly and RUL models surface degradation earlier |
| Maintenance cost per MWh | Average combined-cycle plants: ~$9.10–$13.80/MWh; coal: ~$12–$18/MWh | Top-quartile combined-cycle plants with predictive programs: ~$4.20–$5.80/MWh |
| Plant availability (EAF) | Constrained by fixed PM outages and any forced outages that occur between them | EAF improved; one study showed availability rise from 82.3% to 91.8% |
Use Twin Analytics for Work Orders, Spare Parts, and Cost Control
Plan and Schedule Work Orders Around Risk and Outage Windows
Once the twin sends a valid alert, planners can use that same risk score to decide when the job should happen. The priority score should blend asset criticality, failure probability, remaining useful life, and the next outage or low-load window before the work order is released.
In day-to-day plant work, that score is only part of the picture. Planners also weigh crew availability, lockout/tagout timing, permit timing, and dispatch commitments. Say a turbine auxiliary pump shows bearing-failure risk. That may point to an inspection within 72 hours, but the planner can still wait for the next low-load window instead of taking the unit offline right away. That buffer gives the team time to schedule the job without disrupting dispatch.
Each CMMS work order should include the confirmed failure mode, recommended action, safety steps, and parts list. After closeout, teams should log the as-found condition, parts used, and labor hours. That closeout data should then feed back into the twin.
That same risk view should guide parts planning too.
Forecast Spare Parts Demand and Avoid Stockouts
Time-based maintenance usually stocks parts from OEM lists and past usage. Twin-driven maintenance does it differently. It stocks parts based on predicted failure timing. That shift matters most for long-lead components such as bearings, mechanical seals, switchgear contacts, breaker mechanisms, and transformer accessories, where a stockout can drag out an outage.
For procurement, the main output is failure likelihood over a set time horizon. If the model shows a meaningful failure window before supplier lead time runs out, the reorder trigger should fire at once. If that same part sits on a noncritical backup unit with a distant failure horizon, the team can hold a leaner stock level and cut carrying cost. Predictive methods cut inventory losses by 22.5% versus preventive-only approaches. That difference comes from matching procurement to actual risk instead of fixed intervals.
A simple rule helps: compare expected downtime cost with carrying cost and lead time risk. If a stockout would stop a critical asset, even a low-cost part may need a higher service level. Parts tied to noncritical assets or far-off failure windows can wait. The same failure window used for job scheduling should also set reorder timing and stock levels. Reviewing min-max levels every quarter against current twin health trends keeps stocking decisions tied to current asset condition, not last year’s usage patterns.
Decision Matrix Table: Repair, Order, Refurbish, or Replace
When the twin flags a component for action, the next step is deciding what action fits. Repair makes sense when the component still has moderate life left and repair cost is well below replacement. Refurbishment fits expensive, standardized assets that can be returned to reliable service at a lower total cost. Replacement is the right move when failures keep happening, remaining life is short, or the outage cost of another failure is higher than the capital spend.
For long-lead breakers, transformers, and similar parts, sourcing should line up with the twin’s risk window.
Use the matrix as a quick action screen, then check the choice against outage timing and vendor availability.
| Asset / Component | Remaining Useful Life | Failure Probability | Criticality | Current Stock | Lead Time | Unit Cost (USD) | Recommended Action |
|---|---|---|---|---|---|---|---|
| Turbine bearing | Near-term | High | Critical | None | Moderate | Varies | Inspect now; plan replacement at the next low-load or outage window |
| Main circuit breaker | Near-term, recurring trips | High | Critical | None | Long | Varies | Refurbish candidate or replace at the next planned outage |
| Transformer cooling fan motor | Moderate | Moderate | High | Lean stock | Short | Varies | Keep on hand or reorder if the predicted failure window is inside the lead time |
| Generator auxiliary pump | Moderate | Low | Moderate | Parts on hand | Short | Varies | Repair in place and log the as-found condition |
| Switchgear contact assembly | Near end of rated cycles | High | Critical | None | Moderate | Varies | Order now; refurbish or replace based on inspection findings |
| Aging substation transformer | Long-term degradation | High | Critical | None | Long | Varies | Begin capital planning and replacement sourcing now |
Use shared risk, approved vendors, and approved substitutions before the failure occurs. That’s how teams turn twin alerts into lower downtime and lower maintenance cost.
Conclusion: A Practical Roadmap for Reducing Downtime and Equipment Costs
Once the data, trigger rules, and CMMS connections are set up, the results start to show up in plain numbers. If the data is messy, the triggers are vague, or the CMMS link is missing, the payoff drops fast. One study found that average downtime fell from 18.4 hours per month to 9.7 hours per month after digital twin deployment. That’s a 47.3% drop. In another case, a multi-plant utility reported $2.3 million in first-year savings across a 1.1 GW portfolio from avoided failures and better maintenance planning.
The same pattern shows up across maintenance programs more broadly. Predictive and condition-based maintenance can cut unplanned downtime by 30% to 50% and trim maintenance costs by 18% to 25% compared with reactive strategies. Put that into plant terms and it gets concrete fast: a 4-hour avoided forced outage on a 500 MW unit preserves about 2,000 MWh of generation. That alone can save tens of thousands of dollars, even before you count emergency labor and rush parts.
Those failure-risk estimates shouldn’t stop at maintenance scheduling. They should also shape spare-parts timing. If a model shows rising risk on long-lead components like breakers or transformer bushings, teams can time reorders better and avoid two expensive problems at once: stockouts and shelves full of parts they don’t need yet. For hard-to-source electrical components, platforms like Electrical Trader can help plants move faster when normal procurement takes too long.
Here’s the part many teams miss: analytics don’t cut downtime just because they exist. If digital twin outputs sit on a dashboard and go nowhere, nothing changes. Alerts need to move into approved work orders inside the CMMS. That’s when analysis turns into field action. And that’s what should be measured: outage hours and dollars, not software features.
A simple rollout works best. Start with three to five critical assets. Clean and standardize the data for those assets, set clear triggers, and tie alerts to current CMMS workflows so they create draft work orders with suggested tasks, parts, and due dates. Then compare before-and-after results using metrics like:
- Unplanned outage hours
- Emergency work order count
- Maintenance cost per MWh
- Inventory turns
- Stockout rate
That gives the team a clear read on what’s working before moving to more assets.
FAQs
How is a digital twin different from basic condition monitoring?
Basic condition monitoring watches signals like vibration and temperature, then flags issues when they cross fixed alarm limits. Those limits are usually broad preset thresholds that apply across different operating states.
A digital twin does more than that. It pulls together real-time sensor data, physics-based simulations, and machine learning to model the asset. Then it compares live performance against its predicted normal behavior, which helps spot subtle deviations sooner.
What data problems cause bad maintenance alerts?
Poor data quality is the biggest reason maintenance alerts go wrong in power plants.
A few usual suspects tend to cause the trouble:
- Sensor noise or drift
- Inconsistent sampling
- Misaligned timestamps
- Low meter accuracy or low-resolution data
Power quality issues can make things worse. Harmonics, for example, can distort signals and muddy the picture.
There’s another problem too: fault events are often rare. That sounds good from an operations standpoint, but it creates a data problem. If a model sees too few failure cases, it may miss the failures that matter most because it never had enough examples to learn from.
How long does it take to see ROI from a pilot?
In U.S. power plants, digital twin pilot programs often pay for themselves in 6 months to 2 years. Some predictive analytics platforms have reported average ROI in as little as 3.41 months.
That said, results can vary quite a bit. It depends on how the system is set up, what kind of operating gains the plant gets, and how far the pilot is rolled out across high-impact assets.