

7 Condition-Based Maintenance Tools for Generators
If you wait for a fixed service date, you can miss early warning signs. I’d use seven tools to watch a generator by condition instead: vibration sensors, thermal cameras, oil analysis, partial discharge testing, power meters, remote alarms, and CMMS software.
Here’s the short version: each tool tracks a different failure sign - movement, heat, oil wear, insulation stress, power output, alarm events, and service history. Used together, they help you spot issues before a shutdown, check used generators before purchase, and keep a clean fault record over time.
What I’d focus on:
- Vibration sensors to find imbalance, misalignment, and bearing wear
- Infrared cameras to spot hot terminals, windings, bearings, and cooling issues
- Oil analysis to check wear metals, fuel dilution, water, glycol, and oil life
- Partial discharge testing to check stator insulation condition
- Power meters and analyzers to track volts, amps, kW, frequency, and THD
- Remote alarms to send alerts for failed starts, low oil pressure, overspeed, and more
- CMMS software to turn all that data into work orders, history, and repair decisions
A few numbers stand out right away:
- Oil samples are often pulled every 250 run hours
- Fresh purchase checks should include a thermal scan at 40% to 50% load or more
- Oil change decisions often look at TBN dropping to 50% of new-oil value or about 2.0
- Some CMMS schedules for diesel units trigger at 250, 500, and 1,000 hours
7 Condition-Based Maintenance Tools for Generators: Quick Comparison Guide
What is Condition-based Maintenance | CBM Explained
sbb-itb-501186b
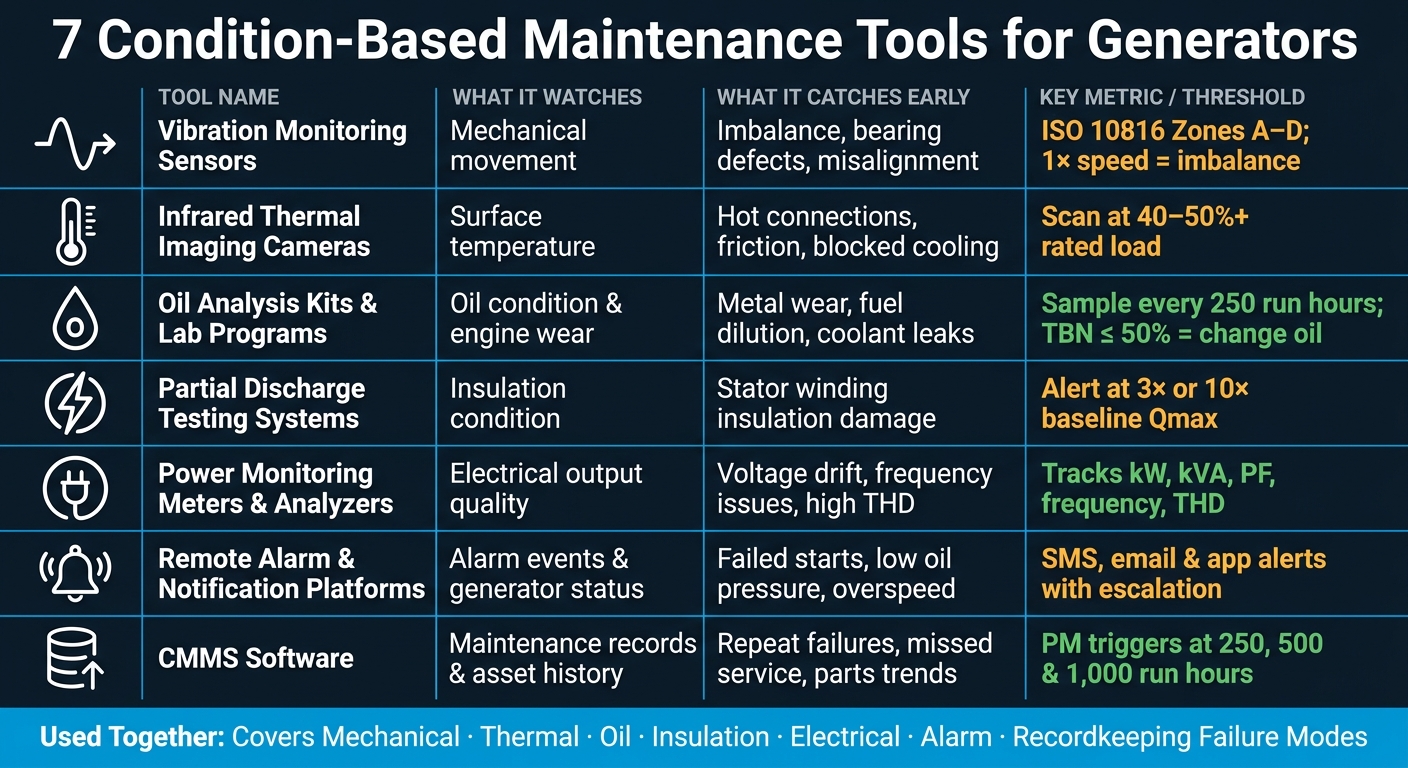
Quick Comparison
| Tool | What it watches | What it can catch early | Best use |
|---|---|---|---|
| Vibration monitoring sensors | Mechanical movement | Imbalance, looseness, bearing defects | Buying, upkeep, fault review |
| Infrared thermal imaging cameras | Surface temperature | Hot connections, friction, blocked cooling paths | Buying, inspections, fault review |
| Oil analysis kits and lab programs | Oil condition and engine wear | Metal wear, fuel dilution, coolant leaks | Buying, upkeep, fault review |
| Partial discharge testing systems | Insulation condition | Stator winding insulation damage | Buying, planned testing, fault review |
| Power monitoring meters and analyzers | Electrical output | Voltage drift, frequency issues, imbalance, THD | Acceptance tests, upkeep, fault review |
| Remote alarm and notification platforms | Alarm events and status | Failed starts, shutdown trips, fuel or battery issues | Daily monitoring, fast response |
| CMMS software | Maintenance records | Repeat failures, missed service, parts use trends | Planning, records, repair decisions |
If I were setting up generator monitoring, I’d start with the failure signs that cost the most: vibration, heat, oil, insulation, power, alarms, and records. That gives you a simple way to decide what to buy, what to monitor, and when to act.
Why Digital CBM Tools Matter Before and After You Buy a Generator
Generator selection shapes how easy it will be to add CBM later. A sensor-ready design matters just as much as nameplate specs like kW, voltage, and fuel type.
Look for features such as:
- Mounting pads or flat surfaces for accelerometers
- Threaded or flanged oil sample ports
- Easy-to-reach points for temperature probes
When those features are built in, a CBM rollout can take hours instead of days. That cuts retrofit work and contractor labor.
Open communication protocols matter too. A generator controller that supports Modbus TCP/IP, BACnet, or Ethernet/IP can send live data - load, voltage, frequency, temperature, and alarms - straight into your building automation system or power monitoring software. Closed protocols can force you to buy costly gateways, and they often make troubleshooting harder over the life of the asset.
Scalability is the third thing to check. A solid digital controller and a basic power meter can deliver value on day one. Then you can add sensors in stages as budget allows. Once the controller and sensor points are in place, that same hardware can keep supporting maintenance and fault detection.
Live data changes how teams handle daily maintenance. Instead of sticking to fixed service intervals, they can trigger work orders when vibration, temperature, or oil readings shift. If trends stay steady across several thousand operating hours, some inspection intervals can be extended safely. If one indicator jumps, the team can respond right away instead of finding out later.
Those readings only help if you store them and compare them over time. Bit by bit, they create a timestamped asset history. Power meters log kW, voltage, and total harmonic distortion. Vibration and temperature sensors track condition trends. CMMS software stores each work order, part used, and technician note.
That history helps teams:
- Spot repeat failure patterns
- Tie faults to operating conditions
- Back up warranty claims
- Decide whether to repair, upgrade, or replace the unit
The first tool to apply this approach is vibration monitoring sensors.
1. Vibration Monitoring Sensors
Vibration sensors show how much a generator moves and shakes while it runs. They’re usually mounted on bearing housings, stator frames, and structural supports. From there, they measure vibration velocity, acceleration, and displacement at key parts. That data helps spot imbalance, misalignment, bearing wear, and looseness before those issues turn into major failures. For a buyer, this is often the difference between a sound unit and a machine hiding an expensive repair bill.
If you’re buying a used generator, a vibration survey at steady-state load gives you a baseline that a visual inspection simply can’t. You can line up the readings with ISO 10816/20816 severity zones. Zones A and B are generally acceptable. Zones C and D mean corrective action is needed. That matters when you’re deciding what the generator is worth and how much money to set aside after the sale.
On the service side, vibration sensors help move maintenance away from fixed calendar dates and toward actual machine condition. Instead of changing bearings just because the schedule says so, technicians watch the trend data. If vibration stays steady, the service interval may be pushed out. If a certain frequency pattern starts to climb, the problem gets much easier to read.
For example:
- Elevated vibration at 1× running speed can point to imbalance
- High-frequency spikes can line up with a bearing defect
That gives the team time to plan a focused repair before a failure hits. In many facilities, that means longer bearing life and fewer unplanned outages. And in places like hospitals and data centers, that’s a big deal because downtime can carry serious consequences.
For fault tracking over the long run, consistency matters. Measure the same bearing points at the same load levels every time. Smaller standby fleets often use portable routes. Critical prime-power units often use online sensors. Different setup, same goal: build a baseline and catch changes early.
Vibration data gets even more useful when you pair it with other CBM inputs. A generator with moderate vibration issues, higher bearing temperatures on a thermal scan, and metal particles in an oil sample is sending a pretty clear message. No single reading tells the whole story on its own. Thermal imaging helps confirm whether vibration is creating heat at a bearing, terminal, or support point. When vibration changes, heat is the next thing to check.
2. Infrared Thermal Imaging Cameras
Thermal imaging cameras show surface temperature patterns across a generator while it’s running. That makes them useful for spotting hot or cold areas that can point to trouble before a failure hits. Vibration tools track movement. Thermal cameras track heat. And heat is often the first clear sign of electrical resistance, mechanical friction, or cooling problems.
That connection matters. If vibration starts to drift, a thermal scan can show whether that change is already turning into heat. In plain terms, it helps confirm whether the part you’re worried about is actually heating up under load.
For anyone checking a used generator, a thermal scan under load is a strong pre-purchase step. Run the unit at 40% to 50% of rated load or higher, then scan the output lugs, switchgear, alternator windings, bearings, exhaust, and radiator surfaces. A healthy generator should show fairly even temperatures across similar parts. Trouble signs include:
- Connections that run much hotter than nearby phases
- Alternator windings outside the expected temperature range
- Radiator sections with cold patches that may point to blocked tubes
The key is simple: compare like parts under the same load and ambient conditions. Bigger temperature gaps deserve faster attention.
For fault tracking, consistency is where thermal imaging pays off. Take images at the same load level, same ambient temperature, and same angle during each inspection cycle. Save every scan with the date in MM/DD/YYYY format, load in kW, and ambient temperature in °F so it’s easy to spot heat trends and review them after a fault.
Thermal scans can also reveal cold anomalies. A cold spot on a phase connection can point to a blown fuse or an open circuit. NFPA 70B requires annual infrared inspection of energized electrical equipment, which backs up the CBM case for keeping a steady scan record instead of treating infrared checks as a once-a-year code task. If the scan points to friction or overheating, check the oil next.
3. Oil Analysis Kits and Lab Programs
Oil analysis helps you track internal wear, contamination, and oil breakdown before those problems turn into a shutdown. As oil moves through the engine, it picks up wear metals, dirt, fuel, water, and chemical byproducts. A standard lab panel checks several items at the same time: viscosity, wear metals like iron, copper, aluminum, chromium, lead, and tin, contaminants such as water, fuel dilution, coolant or glycol, dirt, and silica, plus oil condition indicators like Total Base Number (TBN), Total Acid Number (TAN), oxidation, and nitration.
Those numbers can tell a pretty clear story. Rising iron and chromium often suggest cylinder liner or ring wear. Higher copper or lead may point to bearing fatigue. Glycol in the oil can hint at a coolant leak or a head gasket problem. That’s why oil analysis is useful both before you buy a used generator and during normal service.
Before buying a used unit, ask for an independent oil sample. A visual check can miss internal damage, but the oil often won’t. The sample should come from oil with at least 40 operating hours on it, so the report reflects actual use instead of a fresh oil fill. Review wear metals against OEM limits, check for glycol or fuel dilution, and compare TBN with the oil’s new-oil value. If TBN has fallen to 50% of its original value or to about 2.0 or lower, it’s time for an oil change. And if the lab marks the report as severe or urgent, take that as a major warning sign during the purchase process.
For maintenance, the trend matters more than any single sample. One report is a snapshot. A series of reports shows where the engine is heading. A one-time jump in iron might come from a bad sample or a recent repair, but a steady climb across back-to-back reports is something you need to act on.
A solid sampling routine usually looks like this:
- Pull a sample every 250 operating hours
- Take a midstream sample from a warm engine
- Use a dedicated sampling port and clean equipment
When you feed those lab results into a CMMS, the data becomes much more useful. Teams can set alarm points - say, iron above 100 ppm or a viscosity change greater than ±12% from the new-oil baseline - and have the system trigger work orders when those limits are crossed.
There’s another upside here: oil analysis can cut back on oil changes you don’t need. Fixed-hour drain schedules often throw away good oil, especially in standby generators that don’t run hard for long stretches. If viscosity, TBN, oxidation, and contamination are still within acceptable limits at the scheduled interval, you can extend the drain safely. That lowers oil, filter, and disposal costs without adding risk. If the oil trend looks normal but the machine still has problems, the next step is insulation testing.
4. Partial Discharge Testing Systems
After vibration, heat, and oil checks, PD testing looks at something you can’t see from the outside: the insulation condition inside the generator.
Partial discharge (PD) testing focuses on the electrical condition of generator insulation. It detects tiny electrical discharges that show up in voids, cracks, dirty surfaces, or other weak points in stator winding insulation. Think of it as an early warning sign. PD often shows insulation stress before a failure happens. If no one deals with it, those small discharges can wear away the winding insulation and end in a breakdown.
This is especially useful when you're checking a used generator before buying it. A visual inspection may tell you a lot, but it won’t show hidden trouble like moisture ingress, thermal aging, or surface tracking in stator bars and end windings. An off-line PD test, done with the machine de-energized and powered by an external source under IEC 60034-27-1, can show those issues directly.
When you review the results, low and steady PD activity is a better sign than high or erratic discharge patterns. If you have baseline PD reports from commissioning, compare them with current readings. A several-fold jump in PD magnitude is a serious warning sign.
For maintenance work, trend data matters just as much as the reading from a single test. A sharp jump in PD activity can point to faster insulation wear. To make each test comparable, track:
- PD magnitude
- Discharge count
- Phase angle distribution
- Load
- Temperature
- Humidity
PD monitoring can be done with portable off-line test equipment for spot checks or with permanent online systems that track activity while the generator is running. When that data feeds into a CMMS, teams can set alerts based on multiples of the baseline - often 3× or 10× the original Qmax value - and trigger inspection work orders before a fault grows into a bigger problem.
PD testing covers the insulation blind spot that vibration, infrared, and oil analysis can’t reach. Next, power monitoring shows whether the generator is delivering stable output under load.
5. Power Monitoring Meters and Analyzers
Partial discharge testing shows you the state of the insulation. Power monitoring shows something different: whether the generator is actually putting out the power it’s supposed to.
A power meter or analyzer connects to the generator output and measures voltage, current, kW, kVA, power factor, frequency, and THD. More advanced units can also record voltage imbalance, inrush current, and short power quality events like sags and swells. In plain terms, power monitoring links the machine’s physical condition to the quality of its electrical output.
When you line up power data with vibration, thermal, and oil results, it becomes much easier to spot when a mechanical problem is starting to affect electrical performance.
During acceptance testing, a portable analyzer helps confirm that the generator can hold rated kW, voltage, and frequency as the load climbs to full capacity. If voltage or frequency drifts outside acceptable limits under load, you have hard data to ask for AVR or governor changes before final payment.
In day-to-day use, power meters help teams make better maintenance calls because they show actual load patterns over time. For example, if a standby diesel generator keeps running at low load during weekly exercise tests, the risk of wet stacking and carbon buildup goes up. Meter data can also back up the case for load bank testing or changes to load transfer settings based on how the unit is actually being used.
Power analyzers also give you a time-stamped record of electrical events. They log voltage sags, frequency excursions, phase imbalance, and overcurrent incidents, which lets technicians piece together what was happening before a trip or complaint. Phase imbalance can point to loose connections or uneven loading. High THD can point to non-linear loads that put extra stress on the alternator and insulation.
For most generator setups, the practical move is simple:
- Install a permanent multifunction meter for continuous visibility and trend data.
- Keep a portable power quality analyzer on hand for commissioning, troubleshooting, and periodic audits.
If the meter supports Modbus TCP/RTU or BACnet, its data can feed into a CMMS for work-order tracking. And when the meter picks up a sag, imbalance, or overload, remote alarms can send that event to the right people right away.
6. Remote Alarm and Notification Platforms
Once sensors and meters pick up a change, remote platforms send that signal to the right people fast. These systems turn generator controller data into alerts that operators, facilities teams, and service vendors can act on. Common alerts include low oil pressure, high coolant temperature, low fuel, battery voltage problems, failed starts, overcrank, overspeed, utility loss, transfer switch status, and communication loss.
This should be on the buying checklist right next to kW rating and fuel type. Don’t treat alarms as a nice extra. Buyers should ask for:
- SMS, email, and app alerts
- Dashboards, recipient routing, and backup delivery if internet service drops
A Cat Connect case shows why this matters. A high crankcase pressure alarm led to a shutdown, a cylinder head found out of spec, and a return to service within eight hours.
The alarm itself is only part of the story. Escalation is just as important. If no one acknowledges an event, the platform should pass it to the next technician or supervisor. It should also keep searchable cloud logs so teams can handle after-hours calls and watch multiple sites without guessing what happened.
Those logs turn alerts into fault records. Event logs should track the alarm type, timestamp, acknowledgment time, reset time, and operating state. Over time, that history helps teams spot repeat failures, like recurring low-battery alerts, cooling-related shutdowns, or failed exercise runs. It also gives them documented proof to back up repairs or changes to maintenance intervals. Those alarm records do the most good when they feed into a CMMS.
7. CMMS Software for Generator Maintenance
Once you have alarms in place, a CMMS is what turns all that raw maintenance data into something a team can actually use. It takes alarms, inspections, and sensor readings from vibration, thermal, oil, partial discharge, and power tools, then turns them into work orders, service history, and asset records.
The setup should happen before the generator enters service. A common best practice is to build the asset record during commissioning: add the make, model, serial number, and location; upload OEM manuals and wiring diagrams; link spare-parts lists; and load the manufacturer’s PM schedule with reminders for oil changes, filter swaps, exercise checks, and load-bank testing. For diesel generators, that often means work orders triggered at 250, 500, and 1,000 run hours.
After data starts coming in, the CMMS can turn patterns into action. It can open work orders based on run hours, starts, or threshold breaches, then assign tasks, track parts and labor, and store before-and-after measurements. That matters because recurring problems stay visible instead of getting lost in email threads or handwritten logbooks.
Over time, the failure history becomes one of the biggest strengths of the system. Teams can search past records to check whether an issue - like repeated low-battery failures, coolant leaks, starter problems, or load-related overheating - is a one-off event or part of a pattern. That record supports root-cause analysis, repair-or-replace decisions, and audit-ready compliance files.
For buyers, this kind of data is useful even before a purchase. CMMS records from similar generator units can show failure patterns and life-cycle cost early, which makes equipment decisions less of a guess.
Where to Source Generators, Sensors, and Monitoring Gear
A CBM program lives or dies on fast access to sensors, controllers, and spare parts. If a replacement vibration sensor, control board, or circuit breaker takes weeks to show up, monitoring can stop, repairs can drag, and the maintenance program can start losing its point. Just as important, the right supply source helps keep sensors, alarms, and records running after installation.
The goal is simple: match voltage, fuel, load, and switchgear to the site so monitoring works from day one.
For new and used generators, replacement parts, sensors, breakers, transformers, and power-distribution gear, Electrical Trader gives buyers one place to source compatible equipment. That makes it easier to find the generator and the supporting gear together instead of piecing things together from multiple vendors.
Used generators need the closest review. A unit may look like a bargain, but missing spares or closed protocols can limit CBM right from the start. For used units, check:
- Nameplate data
- Operating hours
- Controller condition
- Prior load-test results
- Spare-parts availability
If service records are thin, inspect the unit more closely before purchase and then use CBM to track condition once it goes into service.
It also helps to specify monitoring hardware at the time of purchase so it connects cleanly with the controller and CMMS. Source for compatibility, not price alone. That cuts down on coverage gaps and helps control life-cycle cost. It also keeps maintenance data moving from purchase into service without custom workarounds.
Conclusion
Once the generator and monitoring gear are in place, CBM shows how the asset is performing over time. No single tool can catch every generator failure mode. But these seven tools, used together, help cover the main gaps: mechanical, thermal, oil, insulation, electrical, alarm, and recordkeeping. That matters during pre-purchase checks, routine upkeep, and post-fault analysis.
Strong CBM programs don’t treat these tools as separate parts. They tie them into one system. When that happens, you get overlapping warning signs, which makes fault isolation a lot easier. The next step is figuring out how much monitoring each asset actually needs.
Choose tools based on voltage class, duty cycle, criticality, and digital integration. High-criticality, high-voltage units often justify continuous monitoring. Standby units, on the other hand, may only need periodic scans, sampling, and alarms.
For each asset, connect the tool stack to the three uses the program is built around: buying, maintenance, and fault tracking. Match the tools to the asset, connect the data, and use what you learn to cut risk and build a cleaner fault history with fewer surprises and faster response.
FAQs
Which CBM tool should I start with?
If you're working with a tight budget, start with vibration monitoring, winding and bearing temperature sensors, and electrical measurements. Those tools give you the clearest look at the main ways a generator tends to fail. And in many cases, they can plug into your existing SCADA or DCS setup.
Put these sensors at the top of the list first. That gives you a baseline for normal operation, which makes it much easier to catch early shifts before they turn into bigger problems.
How often should generator condition data be reviewed?
Generator condition data should be reviewed on a continuous basis so teams can keep an eye on real-time status and track long-term trends, not just rely on set review dates.
Alarm and incident data should also be checked on a regular basis. That makes it easier to spot repeat problems and fine-tune alert thresholds before they turn into bigger headaches.
For oil analysis, review results at every major oil change, or at least once a year for standby units.
Are these tools worth it for standby generators?
Yes. These tools are especially helpful for standby generators, which often sit unused for long stretches. And when equipment sits, small problems can creep in quietly, like fuel oxidation, battery wear, or fluid leaks.
Condition-based maintenance and remote monitoring help keep reliability high by tracking fuel levels, battery voltage, and coolant temperature in real time. That gives teams a clearer picture of generator health, helps stop failures before they happen, and can cut maintenance and downtime costs.