

How to Assess Outage Risk for UPS Systems
A UPS can look fine and still fail when you need it most. If I want to judge outage risk fast, I look at five things first: what the UPS supports, how much load it carries, how long it can run, battery and room condition, and what failure would cost.
Here’s the short version:
- Battery trouble is still the top cause of UPS outages
- A single downtime event can cost $100,000+, and some go past $1 million
- Load above 80% often cuts runtime fast
- Warm battery rooms above 77°F shorten battery life
- Missed maintenance, repeat alarms, and no recent testing are warning signs
- The final check is simple: Likelihood × Impact = Total Risk
If I were doing this at a site today, I would:
- List each UPS and the loads it protects
- Record actual load in kW and kVA
- Compare required runtime to available runtime
- Check battery age, heat, alarms, and service history
- Score the risk and rank what needs action first
A good UPS risk check is not about one reading on a screen. It’s about finding the weak point before a power event turns into lost production, IT downtime, or a safety issue.
The rest of the article walks through that process in a clear order so you can score each UPS the same way every time.
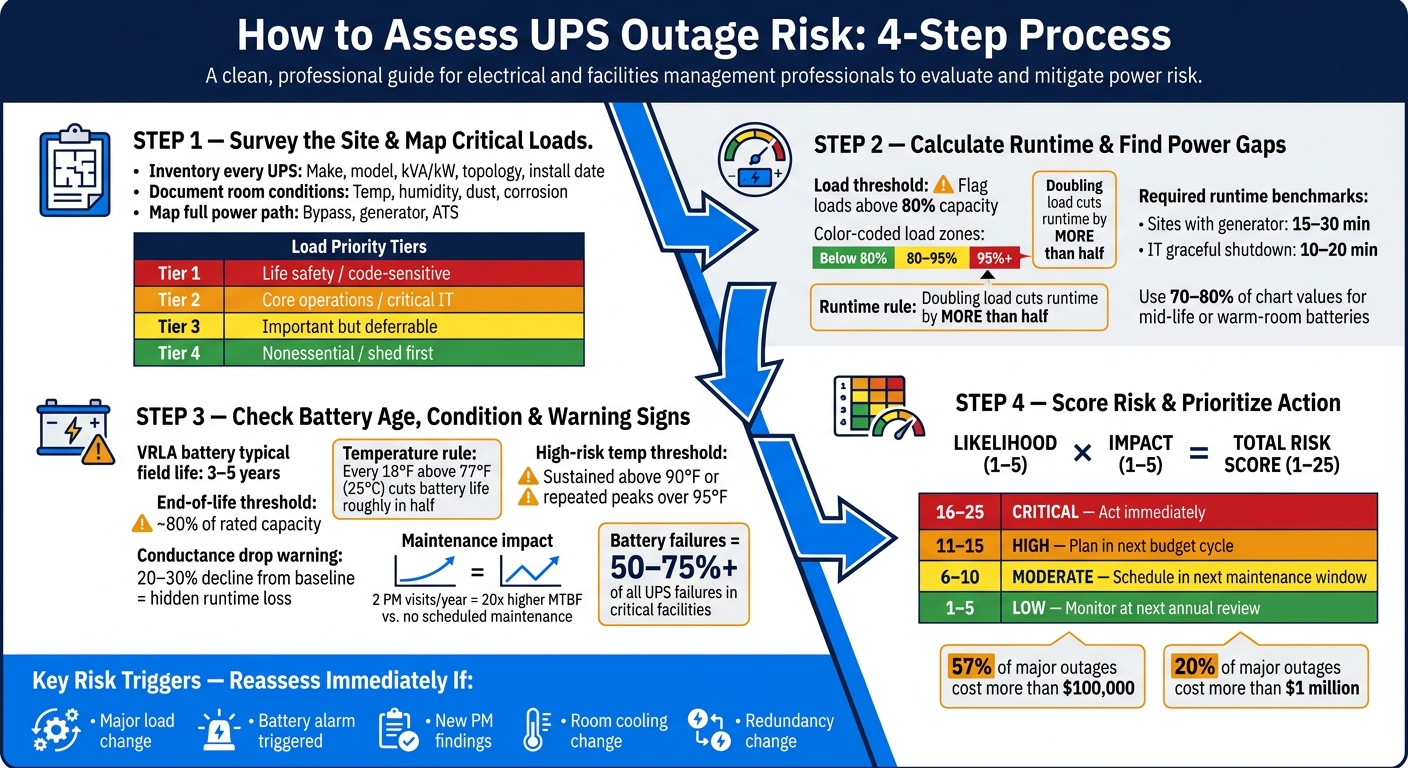
UPS Outage Risk Assessment: 4-Step Scoring Process
Energy Decision # 33 - UPS Explained: How to safeguards critical loads and your bottom line
Step 1: Survey the Site and List Every Critical Load
Without a full inventory, risk ratings are just guesses.
Record the UPS setup and room conditions
For each UPS in the facility, record the make, model, kVA/kW rating, UPS topology (standby, line-interactive, or online double-conversion), install date, battery type and setup, and firmware or controls version if you can get it.
Then document the room conditions around the UPS and battery cabinet: ambient temperature at the UPS inlet, humidity, service access, condensation, blocked vents, dust, corrosion, loose conductors, water intrusion, missing panels, and any burned odor. Any one of these can push failure risk up before age or load even enters the picture. Take photos and log every issue so you can score risk later.
Also map the full power path: the bypass path, generator tie-in, upstream ATS, and downstream distribution path. A UPS might look fine on its own, but the weak link may be a failed bypass, an upstream breaker, or an overloaded downstream panel. Those details matter in Step 2 when you check runtime.
Map connected loads by circuit, kW, VA, and priority
Next, turn the site survey into a circuit-by-circuit load map. Trace every connected load and build a load table that ties each device or panel to:
- Circuit number
- Source panel
- Estimated or measured kW
- Apparent power in VA
- Priority tier
Use metered readings, not nameplate totals, to show actual loading. The U.S. federal facility guidance explicitly recommends a site survey over nameplate summation for establishing real UPS loading, specifying that each load or panel should be documented with actual phase currents, load type, voltage, and peak demand periods.
Record typical operating demand and peak demand as separate figures. Also note whether each load runs continuously, cycles on and off, or pulls high inrush current at startup.
Group loads into four tiers so it’s clear what has to stay on and what can be shed first:
| Tier | Load Type |
|---|---|
| Tier 1 | Life safety or code-sensitive loads |
| Tier 2 | Core operations, production controls, or critical IT |
| Tier 3 | Important but deferrable loads |
| Tier 4 | Nonessential loads that can be shed first |
Use this baseline to compare load, capacity, and runtime in Step 2.
Step 2: Calculate Runtime and Find Power Gaps
Outage risk isn't just about whether a UPS can carry the load. It also has to carry that load for long enough. On paper, a UPS may look fine and still miss the site's runtime target.
Compare current load to UPS capacity
Start by pulling the current load reading from the UPS front panel, monitoring software, or an external power meter. Record both kW and VA. That matters because power factor can limit one before the other.
Next, compare that reading to the UPS nameplate rating in both kW and kVA. Then divide the current kW load by the rated kW capacity to get the percent load.
Use the load map from Step 1 to confirm the current demand before you compare it to capacity.
Runtime margin drops fast once load goes above 80%. Above 100%, the UPS can alarm, transfer to bypass, or shut down. A simple color code makes this easy to scan:
- Green: below 80%
- Yellow: 80%–95%
- Red: 95% and above
Don't rely on one reading by itself. Review trend data too, because load often spikes during shift changes or batch runs.
Compare required runtime to tested or estimated runtime
Once you know the load percentage, check the expected runtime using the manufacturer's runtime chart for that exact UPS model and battery setup. Runtime does not fall in a straight line as load rises. In plain terms, doubling the load usually cuts runtime by more than half.
Required runtime depends on what the site has to ride through during an outage. A server room with a standby generator often needs 15–30 minutes to cover generator start, warm-up, and ATS transfer, plus some margin in case the first start fails. A site without a generator needs enough runtime for a full graceful shutdown, which often lands in the 10–20 minute range for IT spaces. Life safety loads tied to a generator should be planned for the full bridge time, not just a shutdown sequence.
A simple runtime gap table makes the comparison easy to see:
| UPS ID | Rated kW | Current Load | Load % | Required Runtime | Available Runtime | Gap | Status |
|---|---|---|---|---|---|---|---|
| UPS-1 | 40 kW | 20 kW | 50% | 15 min | 22 min | +7 min | Green |
| UPS-2 | 80 kW | 64 kW | 80% | 30 min | 18 min | −12 min | Red |
| UPS-3 | 10 kW | 9 kW | 90% | 10 min | ~9 min (est.) | −1 min | Yellow |
Any negative gap is a confirmed shortfall. Treat every negative gap as a correction item.
If there hasn't been a recent discharge test, trim the chart values to reflect battery age and room temperature. Batteries that run above 77°F (25°C) on a steady basis age faster and provide less usable capacity than the chart assumes. A safe rule of thumb is to use 70%–80% of chart values for batteries past mid-life or kept in warm rooms. Mark those numbers as estimated, and schedule a capacity test within 30 days.
If you find a negative gap, flag it for correction. The fix usually falls into one of three buckets: reduce load, add battery capacity, or repair the support path.
If runtime looks short or even a little close, the next thing to check is battery age and test history.
sbb-itb-501186b
Step 3: Check Battery Age, UPS Condition, and Warning Signs
The runtime gap from Step 2 matters, but it doesn't tell the whole story. A UPS can look fine in a worksheet and still fail when the power drops. Why? Old batteries, skipped maintenance, and hot rooms can eat away at runtime long before the UPS throws an alarm. If Step 2 showed a gap, this is where you find out whether that gap is likely to turn into an outage.
Review battery age, temperature history, and test records
Start with the battery install date. Then compare it to the manufacturer's stated service life and the usual 3–5 year field life of VRLA batteries. Once a VRLA string gets to about 80% of rated capacity, it's commonly treated as end-of-life.
But age by itself isn't enough. Temperature has a huge effect on battery life. In the U.S., a common UPS battery room design point is 77°F (25°C). For every 18°F above that point, battery calendar life is cut roughly in half. So a room that often sits at 90–95°F can wear batteries out much faster than expected, even if the UPS looks quiet on the surface.
Check the BMS logs or sensor history for long stretches above 80–82°F. Treat any room with sustained temperatures above 90°F or repeated peaks over 95°F as high-risk.
Test records are the third part of the picture. Look for discharge, impedance, or conductance trends. One self-test doesn't prove much. If conductance has fallen 20%–30% from baseline over 12 months, that's a strong sign of hidden runtime loss, even if no UPS alarm has appeared. And if there is no discharge or runtime test data at all, treat the runtime figure as an estimate until a capacity test is done.
Use this table to sort battery risk across those three checks:
| Factor | Low Risk | Medium Risk | High Risk |
|---|---|---|---|
| Age (% of rated life used) | 0–60% | 60–80% | 80–100%+ |
| Room temperature | Consistently ≤77°F | Frequent excursions 80–90°F | Sustained above 90°F or repeated peaks over 95°F |
| Test trend | Stable and tested on schedule | Minor decline or limited recent trend data | Declining trend or no recent discharge/conductance data |
Aging batteries and excess heat can wipe out runtime margin before the UPS shows any warning.
Review UPS alarms, service history, and end-of-service-life status
Pull the last 6–12 months of UPS event logs and look for patterns, not just one-off alerts. The alarms that matter most for outage risk are:
- Battery replacement warnings
- Failed battery self-tests
- Inverter faults
- Bypass transfers
- Overload events
One cleared alarm may not mean much. The same alarm showing up again without a documented fix is a different story. That usually means the root issue is still there.
Skipped preventive maintenance is one of the clearest signs of risk in this review. Analysis of large UPS fleets found that units receiving two preventive maintenance visits per year had an MTBF more than 20 times higher than units with no scheduled maintenance. If the last PM visit was more than 12 months ago, or if older service reports flagged battery replacement or fan issues that no one addressed, raise the likelihood score and note those open items.
Then check the age and support status of the UPS itself. Most UPS platforms have a practical service life of 7–10 years, while smaller systems often land closer to 5–7 years. A unit can still be running past that point, sure, but parts get harder to find and repeat faults show up more often. If the UPS is near or beyond that service window, add replacement planning to the risk register.
Battery-related failures make up roughly half to more than three-quarters of UPS failures in critical facilities, so battery condition should be treated as the main risk driver in this step.
Record the following in the risk register:
- Battery age
- Temperature history
- Test trends
- Alarm history
- PM status
- End-of-life flags
Step 4: Score Failure Likelihood, Impact, and Total Risk
Steps 1–3 give you the raw inputs. Step 4 turns that data into one risk score so you can see which UPS needs attention first.
Once you have load, runtime, battery, and condition data, score each UPS and line up the corrective work by priority.
Score likelihood based on load, age, alarms, and room conditions
Use a 1–5 likelihood scale. A score of 1 means failure is very unlikely in the next 12–24 months. A score of 5 means failure is very likely. Score each driver on its own, then use the highest score across load, battery age, alarms, room conditions, and maintenance as the overall likelihood score. Scores of 2 and 4 sit between the anchor points below.
| Driver | Score 1 | Score 3 | Score 5 |
|---|---|---|---|
| Load vs. capacity | ≤50% of rated kVA | 71–85% | ≥96% or frequent overload alarms |
| Battery age | <40% of expected life, regular testing, no issues | 60–80% of expected life or inconsistent testing | >100% of expected life or failed/repeated marginal tests |
| Alarm history (last 12 months) | Informational only, no repeats | Intermittent battery, fan, or temp alarms that cleared after service | Recurring battery faults, overload alarms, or bypass conditions not fully resolved |
| Room conditions | 68–77°F, good airflow, no dust buildup | Occasional temperature excursions, moderate dust, marginal airflow | Persistent temperatures above 80–86°F, poor ventilation, visible corrosion or moisture, or heavy dust around intakes |
Add a Maintenance Score on the same 1–5 scale:
- 1: All manufacturer-recommended PM and battery tests are current, and there are no open findings.
- 2: Minor schedule slips with no unresolved issues.
- 3: At least one missed annual PM or overdue battery test, with minor open findings.
- 4: Multiple missed PMs, overdue battery replacements beyond recommended age, or repeated workarounds.
- 5: No documented maintenance plan, no documented tests, or serious findings left unaddressed.
If PM is more than 18 months overdue, set the Maintenance Score to 5 automatically. Track the last PM date in mm/dd/yyyy so overdue units flag on their own.
Score impact and rank the next actions
Rate impact on the same 1–5 scale based on what happens if that UPS fails. Check five areas: downtime cost, safety exposure, production interruption, restart difficulty, and whether any redundancy exists. Then use the highest score across downtime cost, safety, production, restart difficulty, and redundancy as the overall impact rating.
Uptime Institute's 2025 survey found that 57% of respondents said their most recent major outage cost more than $100,000, and 20% said their most recent impactful outage cost more than $1 million. Any UPS with no backup path and high business or safety impact should score a 5.
After that, multiply the two scores:
Total Risk = Likelihood × Impact
That gives you a score from 1 to 25.
Use these ranges to rank the work:
- 16–25: critical - act at once with clear due dates and owners
- 11–15: high - plan and fund fixes in the next budget cycle
- 6–10: moderate - schedule corrections in the next maintenance window
- 1–5: low - monitor and review at the next annual check
Sort the register by total risk score, highest first.
Record the results in a risk register
Keep one row per UPS. Record the UPS ID, location, loads, capacity, load %, runtime gap, battery age, findings, likelihood score, impact score, total risk score, action, owner, due date, and status.
Use conditional formatting so any score of 16 or higher turns red. If a fix needs parts, log the required equipment and the estimated cost.
Review scores annually in most facilities and quarterly in data centers, hospitals, and large manufacturing sites. Reassess right away if any of these happen:
- a major load change
- a battery alarm
- new findings during a PM visit
- a room cooling change
- a change in redundancy
Use the register as the working list for repairs, replacements, and retests.
Conclusion: Use the Same Process Each Time to Cut UPS Outage Risk
Once you complete the risk score, the payoff comes from using the same method every time. Stick to the same five-step process for each review. That fixed sequence keeps your data comparable, helps you spot trends, and makes it much easier to turn findings into action.
After the first assessment, run the next one on the same schedule. Repeating the assessment shows whether risk is moving up or down. If a UPS scores 8 one year and 18 the next, that system needs attention. Tie those score changes straight to the risk register from Step 4 so each review feeds the next round of corrective work.
UPS failures can be extremely costly, so a structured assessment is one of the lowest-cost ways to cut exposure.
High-risk results should go straight into replacement planning. If a high-risk UPS needs replacement parts or a full swap, record the specs, lead times, and costs in the risk register so purchasing can move fast once approval is granted. Electrical Trader can be used to source replacement electrical components and power distribution equipment when needed.
Set annual reviews for all critical UPS systems. Also trigger an immediate reassessment after any major load, configuration, HVAC, or UPS event.
FAQs
How often should I reassess UPS outage risk?
Use a tiered schedule to check UPS outage risk and keep long-term reliability on track:
- Monthly: inspect batteries and capacitors for wear, corrosion, or leaks.
- Twice a year: perform preventive maintenance for critical systems, including log review and connection tightening.
- Annually: run load bank testing at 50% to 100% capacity.
It also helps to plan part replacement before failure becomes a problem. Replace cooling fans and capacitors every five to seven years, and replace batteries one year before their rated end of life.
What is the fastest way to spot a UPS runtime shortfall?
The fastest way is to use a Battery Management System (BMS). It gives you real-time visibility into cell health, temperature, and charge levels, so you can spot trouble before it turns into an outage.
You should also confirm capacity with annual load bank testing. If you think there may be a shortfall, calculate current runtime with this formula:
(Battery Ah × Battery Voltage × Efficiency) ÷ (Load kW × 16.67)
Then add a 20%–30% safety margin to account for battery age and temperature.
When should a UPS be repaired instead of replaced?
Repair a UPS when a specific part has failed but the main system is still in good shape. This usually makes sense with modular units that allow hot-swappable service, where you can swap parts without taking the whole system offline. It’s also a common call for normal wear items, like cooling fans or filter capacitors, which often need attention every five to seven years.
Replace the UPS when the batteries fail testing, won’t hold a charge, or fall below 80% capacity. Replacement also makes sense when the unit itself is defective, can’t meet readiness standards, or shows damage from heat or moisture.