Real-Time Energy Data: Benefits for Facility Managers
Real-time energy monitoring gives facility managers immediate insights into energy usage, helping cut costs, improve efficiency, and extend equipment life. Unlike traditional monthly reports, it provides detailed, live data that identifies inefficiencies and prevents waste. Here's why it matters:
- Reduce Waste: Detect energy inefficiencies instantly, saving 10–20% on energy use.
- Lower Bills: Manage peak demand charges, which can be 30–70% of electricity costs, with strategies like load shifting and battery storage.
- Predict Equipment Issues: Spot early warning signs of equipment failure, reducing downtime by up to 50%.
- Support Sustainability Goals: Continuous tracking helps lower carbon emissions and meet regulatory requirements.
- Verify Utility Bills: Cross-check real-time data with utility charges to catch and correct billing errors.
These tools turn energy management into a proactive process, saving money and improving building operations. Facility managers can rely on real-time data to make smarter decisions, avoid costly repairs, and meet energy benchmarks effectively.
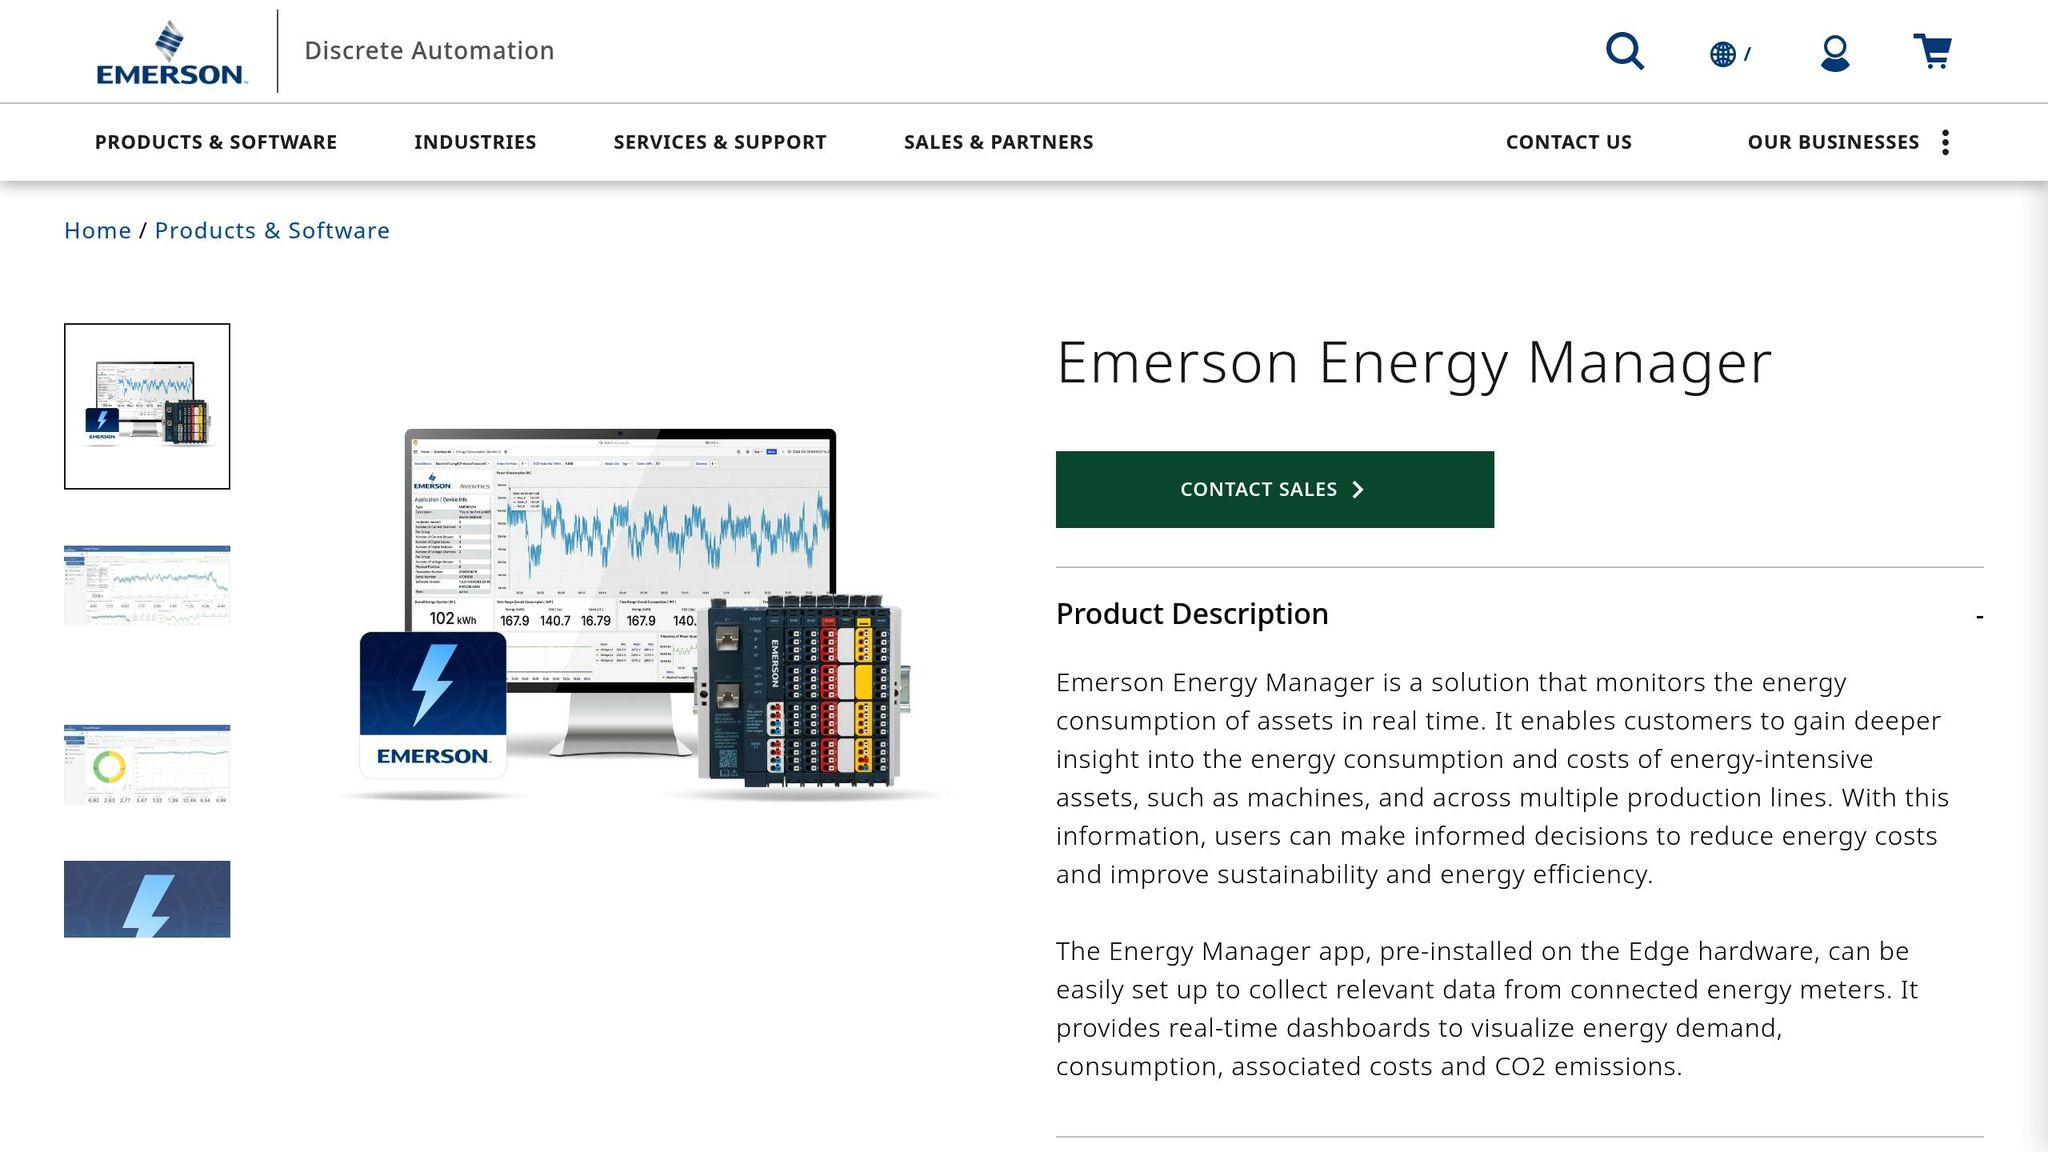
Emerson’s Energy Manager: Real-Time Utility Monitoring for Efficiency
sbb-itb-501186b
Cost Savings and Financial Benefits
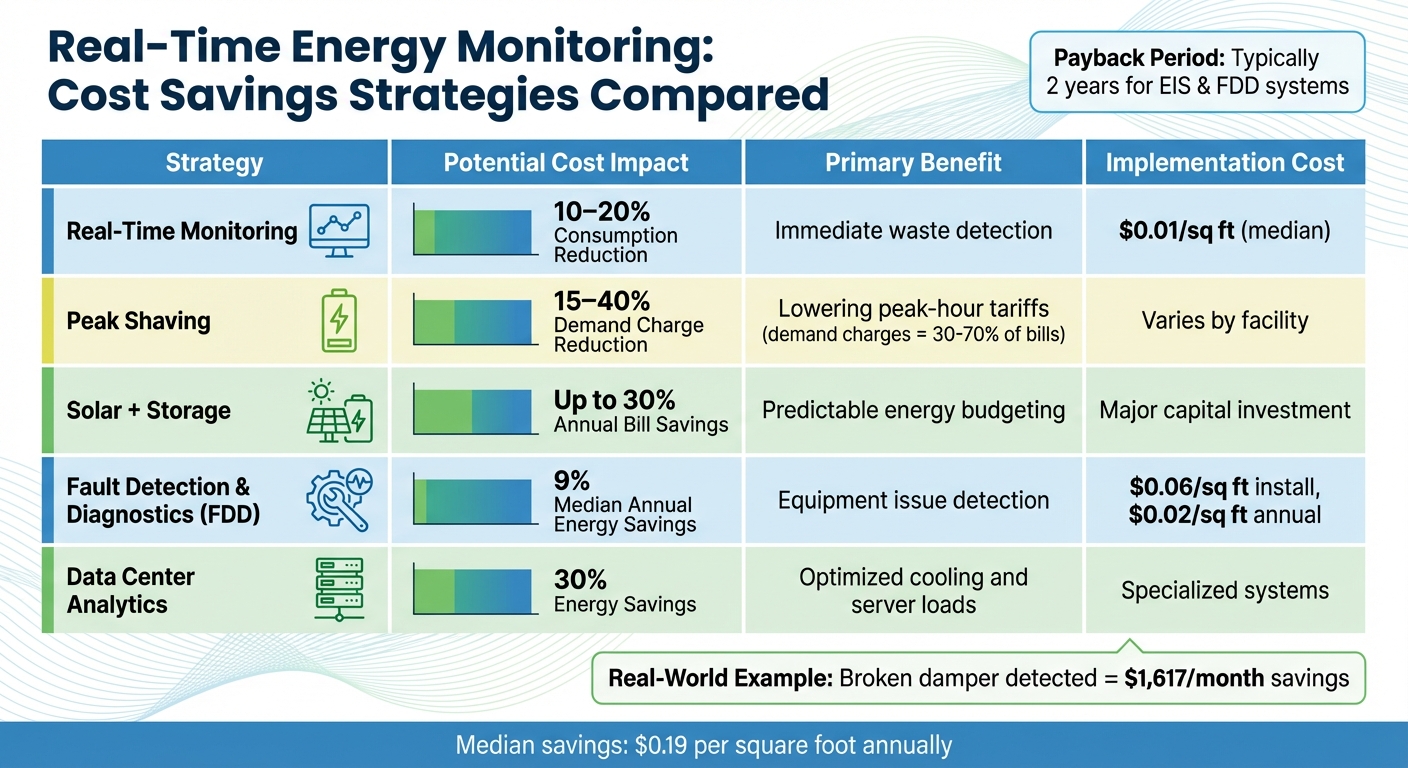
Real-Time Energy Monitoring Cost Savings Strategies for Facility Managers
Finding and Eliminating Energy Waste
Real-time monitoring can uncover energy waste instantly, saving significant costs. For instance, Patrick Towbin, Chief of Engineering at Ecosave, uncovered the impact of such monitoring in September 2025. The system identified a broken outside air damper that was wasting $1,617 every month. With this data, he quickly ordered repairs to halt the losses.
The process works by identifying anomalies like equipment running during off-hours, HVAC systems stuck in override mode, or poorly managed lighting. Automated actions - such as turning off unnecessary lights, enforcing HVAC settings, or shutting down idle systems using occupancy data - can then address these issues. Buildings using these techniques have reported up to 41% reductions in total energy consumption.
These targeted actions also help manage peak demand charges more effectively.
Managing Peak Demand Charges
Demand charges account for a large portion - 30% to 70% - of a commercial electricity bill, making them a major focus for cost control. Real-time monitoring pinpoints when and where energy spikes occur, enabling smarter management.
Facilities can shift energy-heavy activities to off-peak hours or use battery storage to avoid drawing power from the grid during costly peak times. A great example is the LACSD Lancaster-Palmdale wastewater treatment facilities, which installed a 2.6 MW solar system and a 2.5 MW / 5 MWh battery storage microgrid. This setup, paired with advanced controls, helps them manage loads during peak periods and reduce dependence on grid power. Facilities employing peak shaving strategies typically achieve 15% to 40% reductions in demand charges.
An easy way to start reducing demand spikes? Try staggering equipment starts by 15–30 minutes.
In addition to operational savings, real-time data offers a way to ensure billing accuracy.
Verifying Utility Bills for Accuracy
Real-time energy data also improves financial accountability by allowing facility managers to cross-check utility bills against actual usage, catching errors before they lead to recurring overcharges.
Energy Information Systems (EIS) provide tools to validate bills by analyzing real-time data. Janie Jefferies-Freer from MRI Software highlights this advantage:
"Real-time energy data and monitoring will show energy consumption across all business units... the real value in having this kind of analytics in place is that it helps businesses to make informed decisions."
For properties with multiple tenants, sub-metering systems ensure accurate cost recovery by charging tenants based on actual consumption rather than estimates. The median cost for EIS implementation is $0.01 per square foot for both installation and annual maintenance, with organizations typically achieving 3% annual energy savings.
| Strategy | Potential Cost Impact | Primary Benefit |
|---|---|---|
| Real-Time Monitoring | 10–20% Consumption Reduction | Immediate waste detection |
| Peak Shaving | 15–40% Demand Charge Reduction | Lowering peak-hour tariffs |
| Solar + Storage | Up to 30% Annual Bill Savings | Predictable energy budgeting |
| Data Center Analytics | 30% Energy Savings | Optimized cooling and server loads |
Better Decision-Making with Data Insights
Setting Baselines and Spotting Anomalies
Real-time systems help establish energy baselines by predicting normal power usage for each piece of equipment. These forecasts are based on factors like weather, occupancy, humidity, and operating hours. When actual energy consumption strays from these baselines, the system immediately sends alerts. This allows facility managers to quickly detect issues like scheduling drift, manual overrides, or equipment malfunctions. Tools such as Fault Detection and Diagnostic (FDD) systems have been shown to deliver a median annual energy savings of 9%, while Energy Information Systems (EIS) provide about 3% savings.
Joe Fullerton, Energy and Sustainability Manager at San Mateo County Community College District, highlights the benefits of this approach:
"Real-time monitoring allows facility managers to better manage and analyze the vast amount of data being gathered from their buildings and point out where inefficiencies are occurring – shortening the reactive period significantly."
Monitoring Individual Equipment Performance
Sub-metering and current transmitters offer a more detailed view of energy use by tracking specific equipment, such as individual HVAC units or lighting circuits, rather than just the overall building consumption. This level of detail helps identify "energy hogs" - equipment using excessive power - and uncovers the root causes of inefficiencies, whether it's a faulty sensor, equipment running outside of scheduled hours, or a device exceeding its expected power consumption.
For example, in September 2015, the San Mateo County Community College District deployed Schneider Electric's Building Analytics across three campuses and 82 buildings. By benchmarking energy use at both the building and system levels, the district was able to detect equipment anomalies and prioritize maintenance tasks based on energy costs and occupant comfort. This proactive strategy replaced their previous reactive repair approach. These granular insights also allow for immediate operational adjustments to improve energy efficiency.
Adjusting Operations Using Live Data
With the detailed insights gained from baselines and equipment monitoring, live data empowers facility managers to take immediate action, resulting in daily energy savings. Managers can adjust HVAC setpoints, turn off unused equipment, or shift energy-heavy processes to off-peak hours. This practice, known as "monitoring-based commissioning", involves benchmarking a system, making adjustments, and instantly measuring the results.
Jerome Conraud, Energy Manager at McGill University, underscores the importance of acting on this data:
"Success is a matter of creating methods and processes to analyze data and do something with it."
Key actions like automated shutdowns, corrected setpoints, and tightened schedules create savings that build up over time, delivering consistent energy efficiency.
Predictive Maintenance and Equipment Longevity
Real-time energy data does more than just help with day-to-day energy savings - it plays a critical role in predictive maintenance, ensuring equipment lasts longer and operations stay resilient.
Recognizing Pre-Failure Patterns
By analyzing real-time energy data, even small changes in consumption can signal potential equipment issues. Energy Information Systems (EIS) use consumption modeling to highlight deviations caused by factors like weather, occupancy, or operating conditions. When actual energy use strays from expected patterns, the system flags it for further investigation.
Fault Detection and Diagnostics (FDD) software takes this a step further. It reviews Building Automation System (BAS) trend data to catch mechanical problems like stuck dampers, leaky valves, or systems simultaneously heating and cooling. Branch circuit meters can then pinpoint specific units that need attention before minor issues turn into costly failures. Monitoring elements like pressure drops, temperatures, and valve positions also helps identify mismatches between commands and actual performance.
The benefits are tangible. Organizations using FDD tools report median annual energy savings of 9%. These systems typically cost $0.06 per square foot to implement, with recurring annual costs of $0.02 per square foot. FDD tools also prioritize faults based on their potential energy, cost, or maintenance impact, ensuring managers focus on the most urgent repairs first.
Preventing Unplanned Downtime
Detecting abnormal energy patterns - like unexpected spikes or scheduling irregularities - can act as an early warning system for equipment issues. By switching from routine, calendar-based maintenance to condition-based approaches, facility managers can schedule repairs during off-peak times, avoiding disruptive shutdowns during critical operations.
The financial impact of this approach is hard to ignore. Predictive maintenance reduces unplanned downtime by up to 50% and cuts system breakdowns by 70–75% compared to traditional methods. Reactive maintenance, on the other hand, is far more expensive - each incident costs about $400 more than proactive measures. In fact, unplanned HVAC downtime in the U.S. is estimated to cost businesses around $50 billion annually.
Integrating predictive maintenance with a Computerized Maintenance Management System (CMMS) streamlines the process even further. When anomalies are detected, work orders can be generated automatically, ensuring technicians arrive with the right tools and information. This not only improves first-time fix rates but also minimizes downtime.
"Predictive maintenance ... injects intelligence into building maintenance by using objective data to identify issues that may impact future equipment performance." - Brian Cline, Digital Service Manager, Buildings IOT
Cutting Maintenance Costs
Switching to predictive maintenance can lower maintenance costs by 18–25% by reducing unnecessary inspections and avoiding emergency repairs. Unlike the reactive "run-to-failure" approach, this data-driven strategy ensures maintenance happens only when it's truly needed.
A real-world example from January 2018 illustrates the potential savings. Schneider Electric used its EcoStruxure Building Advisor analytics tool to solve a heating issue in a facility's shipping area. Initially, a service provider recommended replacing an "undersized" HVAC unit at a cost of over $40,000. However, the analytics tool revealed the real problem - a misconfigured internal set point. A technician fixed it in less than an hour, saving the company from an unnecessary replacement and preventing further disruptions.
The financial returns on these technologies are impressive. FDD systems often achieve a simple payback within two years, and Energy Management and Information Systems (EMIS) users report median annual savings of $0.19 per square foot. By continuously monitoring performance and addressing issues early, predictive maintenance not only prevents major malfunctions but also extends equipment life while reducing waste in labor and materials.
Meeting Sustainability Goals and Regulatory Requirements
Real-time energy data doesn’t just improve efficiency and predictive maintenance - it’s also a game-changer for meeting sustainability targets and regulatory demands. Instead of waiting for monthly utility bills to analyze energy use, continuous monitoring lets you identify and address waste immediately. This shift not only saves money but also helps organizations take responsibility for their environmental impact and comply with regulations.
Lowering Carbon Emissions
Energy Information Systems (EIS) are powerful tools for reducing carbon emissions. By using data like weather, occupancy, and humidity to set baselines, EIS can detect anomalies that cause unnecessary energy use and emissions. Real-time alerts can even trigger automated actions, such as turning off lights after hours or adjusting HVAC settings. These measures help ensure energy-saving strategies are implemented seamlessly.
The results speak for themselves: EIS-based energy management programs can achieve up to 20% energy savings at a site. Additionally, both EIS and Fault Detection and Diagnostics (FDD) systems typically offer a simple payback period of just two years.
Sub-metering adds another layer of precision by breaking down energy usage at the floor or tenant level. This makes it easier to assign carbon footprints to specific areas. Public dashboards displaying real-time energy consumption can also drive behavioral changes among occupants - like turning off unused lights or lowering heating demands. For perspective, energy reporting technologies in California alone could save roughly 2.5 terawatt-hours annually.
This proactive strategy not only reduces costs but also helps organizations meet formal energy benchmarks.
Supporting Energy Efficiency Certifications
Real-time monitoring is essential for certifications like LEED and ENERGY STAR. It provides the baseline and benchmarking data needed to document progress toward long-term energy goals. Monitoring-based commissioning (MBCx) leverages real-time data to maintain consistent energy savings, ensuring compliance with the ongoing performance standards required by these certifications.
Participants in the Smart Energy Analytics Campaign reported median annual savings of $0.19 per square foot, highlighting the financial benefits of granular energy data. This level of detail also meets the requirements for energy audits and compliance with updated energy codes. By automating data collection through APIs or smart meters, organizations can streamline portfolio-wide benchmarking and avoid errors from manual data entry.
"Real-time data allows you to measure the specific impact of building efficiency improvements and use it to track progress easily, justify future projects, and establish long-term energy goals." - Yardi Systems, Inc.
Continuous monitoring ensures the robust data needed to meet certification standards and maintain energy efficiency over time.
Meeting Energy Reporting Requirements
Regulations like the Energy Performance of Buildings Directive (EPBD) 2024 are raising the bar for energy monitoring. Instead of relying on periodic certificates, these regulations require continuous tracking, logging, and analysis for large non-residential buildings. Real-time systems provide the detailed documentation needed to meet these stricter standards for transparency and traceability.
Automated data ingestion eliminates the inaccuracies of manual spreadsheets, delivering consistent, audit-ready records. These systems also enable automated measurement and verification (M&V) of energy-saving measures, offering the proof of performance required by many energy directives.
"EPBD 2024 strengthens digital monitoring and data collection on top of existing periodic reporting." - Enity
With real-time visibility, facility managers can quickly address issues like equipment malfunctions or energy deviations, avoiding the delays that come with traditional billing cycles or audits.
Conclusion: Why Facility Managers Need Real-Time Energy Data
Relying on reactive facility management can delay the detection of problems by up to 30 days. This delay often leads to wasted energy, increased costs, and even potential damage to equipment. On the other hand, real-time energy monitoring allows facility managers to address issues immediately, paving the way for operational and financial improvements.
With commercial buildings often struggling with inefficiencies, real-time monitoring offers a practical solution. It provides measurable benefits like reduced energy consumption and lower demand charges. Considering that demand charges can account for anywhere from 30% to 70% of a commercial electricity bill, having real-time insight into peak loads can directly impact cost savings. Tools like Energy Information Systems (EIS) and Fault Detection and Diagnostics (FDD) typically recover their initial investment within two years.
But the benefits don’t stop at cost savings. Real-time data empowers facility managers to identify early warning signs - such as unusual motor vibrations or inefficiencies in compressors - so they can fix problems before they escalate. This proactive approach not only extends the life of equipment but also minimizes the risk of costly downtime that can disrupt operations.
FAQs
What should I monitor first to get quick energy savings?
Monitoring energy usage at the sub-meter or individual equipment level is a smart first step. It allows facility managers to identify specific areas where energy is being wasted. By addressing these issues directly, they can achieve immediate cost savings while boosting overall efficiency.
How do I use real-time data to reduce demand charges?
Facility managers have a powerful tool at their disposal: real-time energy data. By keeping an eye on consumption patterns, they can act quickly during peak demand periods. For instance, identifying high-usage times allows them to make operational adjustments, such as scaling back HVAC loads or delaying the startup of certain equipment. These small tweaks can help sidestep expensive peak demand charges.
Taking it a step further, integrating energy monitoring systems with building management systems (BMS) can automate these load adjustments. This not only streamlines energy use but also helps cut costs during demand response events, making the process both efficient and cost-effective.
Do I need submetering, and where should it go?
Submetering gives facility managers a closer look at energy consumption, breaking it down to specific systems or equipment. By monitoring usage below the main utility feed, it helps pinpoint waste and improve overall efficiency.
To get the most out of submetering, placement is key. Focus on areas like HVAC systems, lighting circuits, or other high-energy processes. A clear and organized setup ensures you capture the full picture without gaps, making it easier to analyze data and implement targeted solutions.