Emergency Power Solutions for Data Centers
One minute of data center downtime can cost $10,000 to $30,000+. So if I want uptime, I need more than a generator in the yard. I need a power plan that covers the full path from utility feed to rack, with UPS backup, generator capacity, transfer gear, fuel runtime, testing, and maintenance all working together.
Here’s the short version:
- UPS systems bridge the gap when utility power drops and the generator starts.
- Generators need extra capacity, often around 125% of critical load or 150% when UPS recharge is included.
- Redundancy level matters: N, N+1, 2N, and 2N+1 each change outage risk, maintenance limits, and cost.
- A/B power paths only work well when servers have dual power supplies connected to separate paths.
- Fuel planning is part of uptime planning, with common runtime targets of 12, 72, or 96 hours based on site goals.
- Testing is not optional: monthly generator tests, annual load bank testing in some cases, and full-system checks help catch failures before an outage does.
- Monitoring, logs, and runbooks help teams respond fast when power events happen.
If I strip it down even further, the article comes to one point: emergency power is a full system, not a single piece of equipment. The job is to size it right, build in backup paths, test it under failure conditions, and keep records that prove it will work when needed.
A few numbers shape most decisions:
- 99.999% uptime allows only about 5.26 minutes of downtime per year
- NFPA 110 Type 10 calls for transfer within 10 seconds
- Generator output can drop about 3.5% per 1,000 feet above sea level
- Stored diesel should be checked quarterly
- A 20% to 25% load buffer helps with growth and derating
This article walks through the main parts of that plan in plain terms: power path design, redundancy choices, fuel runtime, battery storage, commissioning, maintenance, monitoring, and equipment buying.
Core Emergency Power Architecture for Data Centers
Utility-to-Rack Power Path
To turn uptime targets into a design that works in practice, map the full utility-to-rack path. Power usually enters the site at medium voltage. From there, it moves through switchgear, transformers, switchboards, UPSs, PDUs, and rack PDUs before it reaches IT loads.
Each step in that chain has a job: keep the rack powered during a transfer or equipment failure. In redundant sites, paralleling switchgear lets generators synchronize and split load. During an outage, every layer needs to pass power cleanly to the next one. If one handoff gets messy, the rack feels it.
UPS, Generators, and Transfer Equipment
When utility power drops, the UPS carries the load at once while the generator starts and reaches a stable output. The ATS watches utility power, starts the generator, and transfers the load after generator output is stable. In high-reliability designs, a static transfer switch (STS) can move between two independent sources in under 4 milliseconds.
There’s a catch after transfer: UPS recharge and load recovery can cause a surge large enough to trip an undersized generator. That’s why generator sizing can’t be done on IT load alone. Size generators for at least 125% of critical load, or 150% when UPS recharge is included.
Fuel Storage and Runtime Planning
Fuel runtime needs to match the site’s target tier and its refill plan. The standard targets are:
- 12 hours for Tier I and II
- 72 hours for Tier III
- 96 hours for Tier IV
That number only works if refueling works too. Facilities should keep 24/7 fuel delivery contracts in place and confirm fuel-truck access during severe weather so deliveries can still happen during an outage. Stored diesel should also be tested quarterly under ASTM D975 standards to catch microbial growth and oxidation before they hurt engine performance.
HVO renewable diesel can be stored for up to 10 years, compared with 6 to 12 months for conventional diesel. Operators use it to stretch storage life and support sustainability goals. That runtime target becomes the starting point for the redundancy choices that come next.
sbb-itb-501186b
How Data Center Electrical Systems Work Power, UPS, and Backup Generators Explained
Designing Redundancy and Resilience
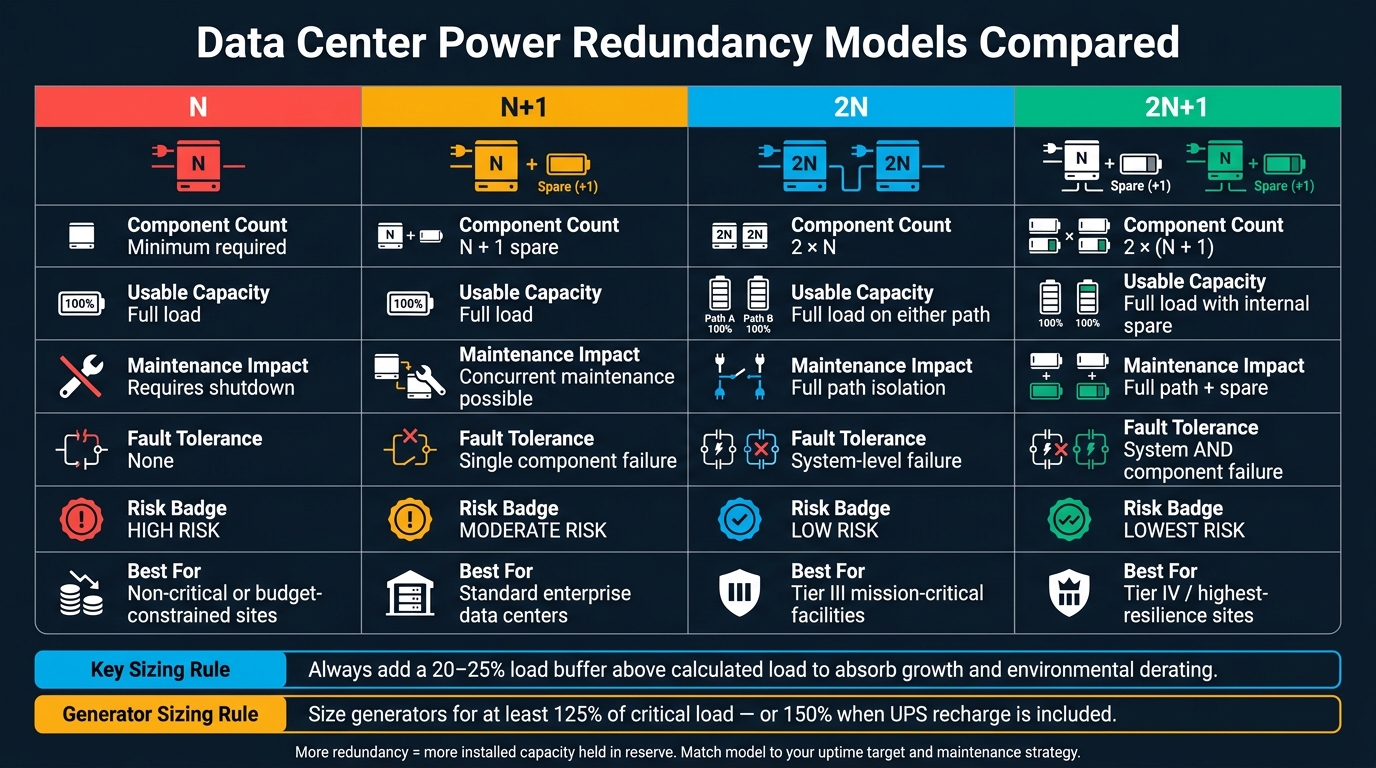
Data Center Redundancy Models: N vs N+1 vs 2N vs 2N+1 Compared
Once your runtime targets are set, the next step is deciding how much redundancy the site needs.
Choosing N, N+1, 2N, or 2N+1
Redundancy shapes cost, service work, and fault tolerance. The right model depends on your uptime target, how you plan to handle maintenance, and how much failure risk you can accept.
N gives you no spare capacity. If one part fails, the whole site can go down. N+1 adds one spare unit, so you can do maintenance at the same time the load stays online. 2N duplicates the full system into two separate paths, and either path can carry the full load on its own. 2N+1 takes that duplicated setup and adds an extra spare unit for the highest level of resilience.
| Model | Component Count | Usable Capacity | Maintenance Impact | Fault Tolerance |
|---|---|---|---|---|
| N | Minimum required | Full load | Requires shutdown | None |
| N+1 | N + 1 spare | Full load | Concurrent maintenance possible | Single component failure |
| 2N | 2 × N | Full load on either path | Full path isolation | System-level failure |
| 2N+1 | 2 × (N + 1) | Full load with internal spare capacity | Full path + spare | System and component failure |
There’s a clear trade-off here. More redundancy means more installed capacity sitting in place for protection, not just day-to-day use. That’s why growth planning matters. A 20%–25% buffer above the calculated load is a practical starting point to absorb expansion and environmental derating.
Of course, extra capacity only helps if the power distribution design keeps that backup path alive during a fault.
Distribution Layouts and A/B Power Paths
Power path topology decides whether redundancy holds up when something breaks. A single-radial layout sends one path from source to load. It’s simple and lower cost, but one fault anywhere on that line can cause an outage. A primary-selective transfer design adds a second upstream source that the facility can switch to, which improves availability without duplicating the whole system. A dual-bus (A/B) layout runs two fully separate paths all the way to the rack, and each server connects through redundant power supply units (PSUs).
For A/B designs to do their job, the IT gear needs redundant PSUs, with each cord tied to a different power path. If a server only has one cord, the path separation doesn’t help much. Physical separation matters too. Independent generator plants should sit in separate switchgear rooms and connect only through a tie breaker.
| Topology | Uptime Strength | Maintenance Flexibility | Fault Isolation | Complexity | Suitable Tier |
|---|---|---|---|---|---|
| Single-Radial | Low | None | Poor | Low | Tier I |
| Primary-Selective Transfer | Medium | Limited | Moderate | Medium | Tier II |
| Dual-Bus (A/B) | High | High | Excellent | High | Tier III/IV |
Redundancy now goes past generators alone. Storage and site-level controls are part of the picture too.
Battery Storage and Microgrid Options
Most UPS batteries only provide a few minutes of ride-through before generators take over. Battery energy storage systems (BESS) push that window further by handling short outages, supporting peak shaving, and allowing microgrid operation .
A microgrid combines BESS, backup generators, and automated controls that handle switching between grid-connected mode and island mode. In practice, BESS deals with the instant response and short events, while diesel generators carry the site through long outages, often 48–72 hours. Put simply, batteries cover the handoff and control layer; generators cover the long haul.
Any U.S. BESS or microgrid project needs utility interconnection approval and tested island-mode logic. Lithium-ion is now the main chemistry for many data center BESS deployments because it offers higher energy density, longer service life, and lower maintenance.
Implementation, Testing, and Ongoing Maintenance
Once the system architecture is set, the job shifts to proving it works, keeping it in shape, and watching it all the time.
Commissioning and Integrated System Testing
After the emergency power path is installed, it needs to be tested under failure conditions. Not on paper. Not in theory. Under the kind of stress it will face when utility power drops.
Commissioning usually moves through three stages: Factory Acceptance Testing (FAT), Site Acceptance Testing (SAT), and Integrated System Testing (IST). FAT takes place at the manufacturer's facility before equipment ships. It checks protection alarms, control logic, and step-load response. SAT comes after installation and verifies utility loss simulation, staged motor restarts, and thermal stability. IST is the last step. It simulates a utility failure and confirms that the full system, from ATS to cooling, works as one. In other words, it validates the complete utility-to-rack chain, not just each device on its own.
Type 10 still has to transfer full load within 10 seconds. One issue that gets missed all the time is the UPS recharge spike after transfer. If the generator is undersized, that extra demand can trip it right after the handoff.
If monthly tests stay below 30% of nameplate load, NFPA 110 requires an annual 100% load bank test for at least 2 hours. That rule exists for a reason. Running too lightly can lead to wet stacking, where unburned fuel builds up in the exhaust system.
Maintenance Intervals, Logs, and Compliance
Steady maintenance and complete records cut outage risk and inspection problems. A missed service interval or missing log can fail an inspection just as easily as a hardware fault. For U.S. data centers, NFPA 110 sets the baseline, and the intervals below follow those requirements:
| Equipment Type | Service Interval | Core Task | Standards Reference |
|---|---|---|---|
| Generator | Monthly | 30-minute operational test at ≥30% nameplate load | NFPA 110 |
| Generator | Annual | 2-hour load bank test at 100% capacity (if monthly load is <30%) | NFPA 110 |
| EPSS (Full System) | Triennial (36 mo) | Full EPSS test under essential load | NFPA 110 |
| ATS / STS | Quarterly | Contact condition, timing relay calibration, manual override check | UL 1008 / NFPA 110 |
| Fuel System | Quarterly | Fuel quality sampling (ASTM D975) and microbial analysis | NFPA 110 |
| UPS / Batteries | Monthly / Quarterly | Battery impedance testing and measured runtime calibration | NFPA 111 / IEEE 450 |
For an Authority Having Jurisdiction (AHJ) inspection, the paperwork matters just as much as the hardware. Keep these records current:
- Monthly test logs
- Annual load bank reports
- ATS inspection records
- UPS battery reports
- Fuel receipts
- Deficiency log
Automated logging systems that store timestamped data for every generator start are now the industry standard, taking the place of manual logbooks.
Monitoring, Alarms, and Operating Procedures
Testing and maintenance set the baseline. Continuous monitoring is what keeps the system ready between service visits.
BMS and DCIM track voltage, frequency, coolant temperature, oil pressure, and fuel levels in real time. That gives operators a shot at spotting trouble before it turns into failure. Infrared thermography on switchgear, ATS components, and UPS cabinets under full load can also expose hot spots and overloaded distribution paths that plain electrical readings may not catch.
Clear runbooks matter here too. Utility loss, failed generator start, fuel resupply, and load shedding should all be documented. In a power event, people do not have time to debate what happens next. Good runbooks cut response time during transfer, restart, and load shedding events, and they protect the most critical IT systems by spelling out which loads drop first and in what order.
Equipment Selection, Procurement, and Conclusion
Selecting UPS, Generators, and Distribution Equipment
Once you've locked in topology and redundancy, the next step is simple in theory and tricky in practice: pick equipment that the site can actually use, grow with, and pay for. That means procurement has to weigh spec compliance against lifecycle cost, not just the price on the quote.
For UPS systems, lithium-ion has a clear upside. It takes up less space, needs less maintenance, and performs better during discharge. The tradeoff is the upfront cost, which is higher.
On the generator side, diesel is still the common choice because on-site fuel gives you runtime that doesn't depend on the grid. Natural gas can make sense for sites that want lower emissions, but there's a catch: you're tied to gas supply availability.
Sizing matters more than many teams expect. Equipment should cover the current load, planned growth, and altitude derating. Generator output drops by about 3.5% per 1,000 feet above sea level. At 5,000 feet, that's about 17.5% less than nameplate capacity before you even put load on the unit. That's not a small haircut.
A few checks are worth making before anything gets ordered:
- Size for present demand and future expansion
- Account for altitude derating during generator selection
- Use closed-transition ATS units if you need testing without dropping the load
- Confirm ratings for standard U.S. voltages, usually 480/277V or 208/120V based on the distribution tier
Using Electrical Trader for Sourcing and Phased Upgrades
After the specs are set, phased sourcing can keep the upgrade path in step with load growth instead of forcing a big one-time buy. Electrical Trader can support phased upgrades by supplying breakers, transformers, switchgear, and generators as the buildout expands.
Conclusion: Building a Reliable Emergency Power Strategy
Emergency power only works when architecture, equipment, testing, and maintenance function as one plan. In plain English, this is a lifecycle decision. Size for today's load, leave room for growth, test under real conditions, and maintain to NFPA 110. Buy for total value, not just the lowest quote.
FAQs
How do I choose between N+1 and 2N?
Choose based on your facility’s risk tolerance, budget, and uptime needs.
N+1 adds one spare unit beyond the minimum needed. That makes it a lower-cost option, but it still relies on a shared distribution path.
2N uses two fully separate mirrored power systems. It gives you more fault tolerance and lets you maintain one side while the other stays online, though it comes with a higher upfront cost.
How much generator runtime should a data center have?
Runtime mostly comes down to two things: a data center’s Uptime Institute Tier and how much fuel it keeps on-site.
- Tier I and II: 12 hours
- Tier III: 72 hours
- Tier IV: 96 hours
That said, the plan doesn’t stop at the tier rating. Based on the business model and service-level agreements, enterprise and colocation facilities may target anywhere from 24 to 72+ hours of continued operation.
What is the biggest mistake in backup power design?
The biggest mistake is getting the generator size wrong.
That usually happens when people size it for the average running load and skip transient surge loads like startup inrush current from large cooling equipment. On paper, the numbers may look fine. In a grid outage, that same generator can sag, trip, or fail right when it’s needed most.
Another issue is skipping environmental derating for altitude and temperature. A unit that looks big enough in one setting may not perform the same way in hotter weather or at higher elevations.
There’s also a basic but common problem: leaning on assumptions instead of verified commissioning results. Estimates are one thing. Tested performance is what tells you whether the system will hold up when the power drops.