How to Identify and Fix Harmonic Distortions
Harmonic distortions can disrupt electrical systems, causing equipment failures, overheating, and inefficiencies. These distortions arise from non-linear loads like LED lighting, computers, and variable frequency drives (VFDs). Here's how to tackle them:
-
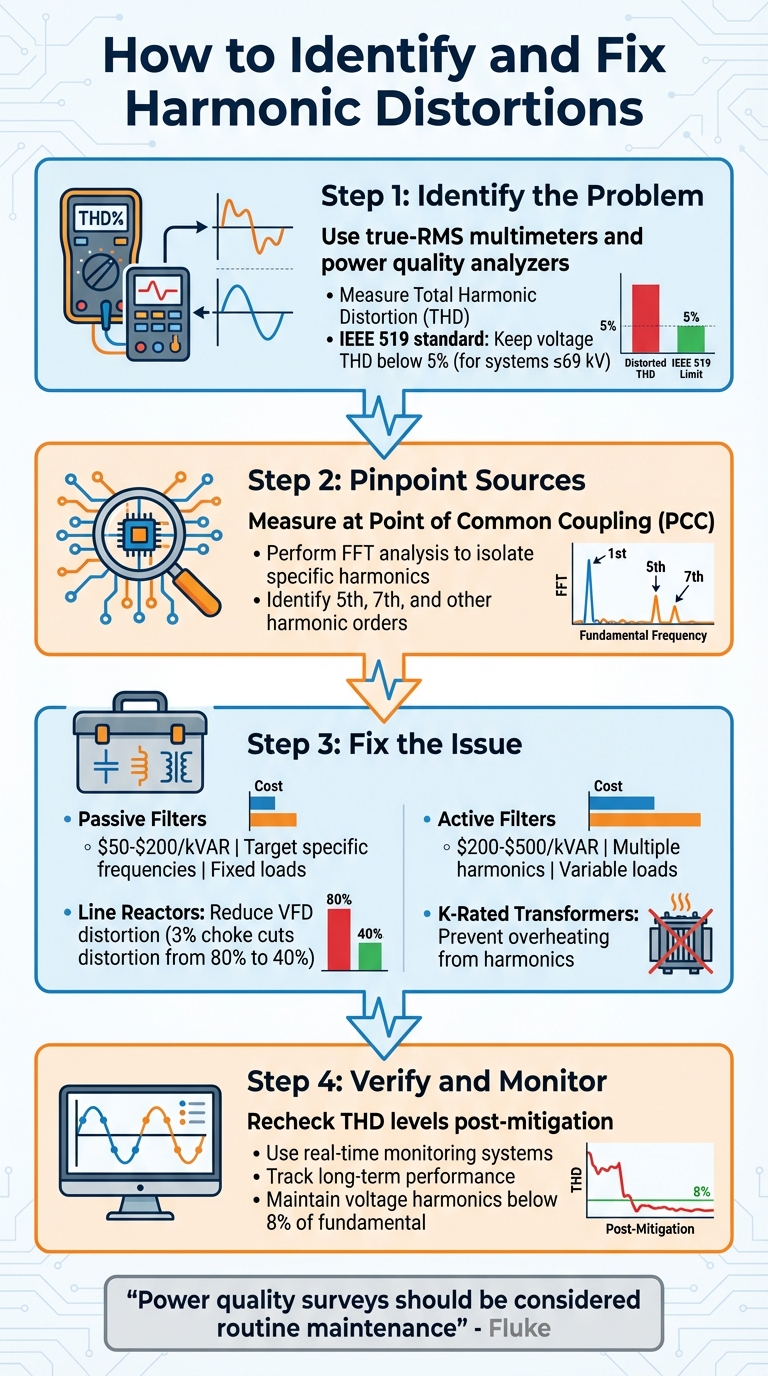
Identify the Problem:
- Use tools like true-RMS multimeters and power quality analyzers to measure distortions.
- Analyze Total Harmonic Distortion (THD) to assess power quality. IEEE 519 standards recommend keeping voltage THD below 5% for systems at 69 kV or below.
-
Pinpoint Sources:
- Measure at the Point of Common Coupling (PCC) and critical equipment locations.
- Perform FFT analysis to isolate specific harmonics (e.g., 5th, 7th) and their sources.
-
Fix the Issue:
- Passive Filters: Target specific harmonic frequencies; cost-effective for fixed loads.
- Active Filters: Handle multiple harmonics dynamically; ideal for variable loads.
- Line Reactors: Reduce distortion for VFDs.
- Transformers: Use K-rated or zig-zag transformers to manage overheating and neutral currents.
-
Verify and Monitor:
- Recheck THD levels post-mitigation.
- Use real-time monitoring systems to track long-term performance and detect new issues.
Key Takeaway: Harmonic distortions can be managed with the right tools, analysis, and targeted solutions. Start by identifying the problem, apply suitable fixes, and continuously monitor your system for optimal performance.
4-Step Process to Identify and Fix Harmonic Distortions in Electrical Systems
Tools and Techniques for Identifying Harmonic Distortions
Tools for Harmonic Detection
To identify harmonic distortions effectively, you need the right tools. True-RMS multimeters are essential for single-phase applications because they measure the actual heating value of distorted waveforms. In contrast, average-responding meters can underreport readings by as much as 50% when dealing with distorted currents. Reliable options for single-phase troubleshooting include the Fluke 170 or 180 series. For non-linear branch circuits, clamp meters like the Fluke 335, 336, or 337 are excellent choices.
For three-phase systems or in-depth harmonic surveys, power quality analyzers are indispensable. The Fluke 430 series, for instance, provides detailed data on voltage and current harmonics across all three phases simultaneously. These analyzers use FFT (Fast Fourier Transform) algorithms to break down waveforms into their individual harmonic components, allowing you to quantify 3rd, 5th, 7th, and higher-order harmonics. To ensure accuracy up to the 50th harmonic, your analyzer should have a sampling rate of at least 128 samples per cycle, although many high-end models go beyond this with 256 samples or more.
Infrared meters are also useful secondary tools. They can detect overheated neutrals, panelboard connections, or transformer windings, which often indicate underlying harmonic problems. These tools provide the groundwork for a deeper harmonic analysis.
How to Perform Harmonic Analysis
Once you have the right tools, conducting harmonic analysis involves a series of steps. First, check your meter's specifications. According to Fluke Corporation, "True‐rms meters give correct readings for any wave shape within the instrument's crest factor and bandwidth specifications". The crest factor - defined as the ratio of a waveform's peak value to its RMS value - should be high enough to account for waveform distortion. For a pure sine wave, this ratio is 1.414, but distorted waveforms will show higher values.
After confirming your meter settings, focus on strategic measurement points. Begin at the Point of Common Coupling (PCC), where your facility connects to the utility, then move to isolation transformers, the main service entrance, and other critical loads. Power quality analyzers and oscilloscopes use FFT analysis to display the magnitude of each harmonic as a percentage of the fundamental frequency. For example, in a typical six-pulse rectifier, the 5th harmonic might be around 20% of the fundamental, while the 7th harmonic could be about 14%.
Selecting the Right Equipment
Choosing the right equipment depends on your analysis needs. For general troubleshooting or surveys, Class S instruments with ±0.5% voltage accuracy are sufficient. However, for precise measurements, opt for Class A instruments with ±0.1% voltage accuracy, as defined by IEC 61000-4-30 standards.
When measuring current, standard current transformers (CTs) may saturate during fault conditions, leading to inaccurate harmonic readings. Rogowski coils, on the other hand, maintain accuracy over a broad bandwidth and are particularly effective for large conductors. Additionally, ensure your analyzer can measure up to the 50th harmonic (approximately 3,000 Hz in 60 Hz systems) and features a 12-bit to 16-bit ADC resolution. Keep in mind that installation costs can add 20% to 50% to the equipment's purchase price.
sbb-itb-501186b
Step-by-Step Guide to Identifying Harmonic Distortions
Step 1: Measure Voltage and Current Waveforms
To start, use true RMS meters to capture accurate heating values of waveforms. Be cautious - average-responding meters can underreport distorted waveforms by as much as 50%.
"Correctly measuring and interpreting voltage and current waveforms are critical when you're trying to determine what's behind any power quality problem".
Begin your measurements at the Point of Common Coupling (PCC) - the point where your facility connects to the utility grid. This is key to identifying whether the distortion originates from the utility side or within your facility. According to IEEE Standard 519-1992, voltage THD at the PCC should not exceed 3%. After the PCC, move to other critical points like isolation transformers, the main service entrance, and specific equipment to further pinpoint the source.
It's important to collect data over several days, not just a few hours. Equipment operates on cycles, with varying loads throughout the day and week. For three-phase, four-wire systems, pay close attention to the neutral conductor. Triplen harmonics (3rd, 9th, 15th) can accumulate in the neutral, potentially causing dangerous overheating. Keep current waveform distortion below 4% across your facility’s distribution system.
Once you’ve gathered accurate waveform data, proceed to analyze the frequency components to identify and quantify the harmonics.
Step 2: Perform FFT Analysis
After measuring waveforms, use FFT (Fast Fourier Transform) analysis to break down the time-domain data into individual harmonics. This reveals the fundamental frequency (60 Hz in the U.S.) along with its harmonic multiples.
"Any complex, periodic waveform can be uniquely broken down in terms of harmonics, making a harmonic analysis a useful way of analyzing nonlinear distortion".
Configure your analyzer with an integer-cycle window (e.g., 10 cycles) and at least 128 samples per cycle. This setup ensures you can capture harmonics up to the 50th order (3,000 Hz in a 60 Hz system). The results are typically displayed as a harmonic spectrum - a bar graph showing the magnitude of each harmonic as a percentage of the fundamental frequency. For example, a 5th harmonic at 20% and a 7th at 14% is common for six-pulse rectifiers. If one harmonic stands out, check if power factor correction capacitors are resonating with the system impedance.
Step 3: Calculate Total Harmonic Distortion
With individual harmonics identified, calculate the Total Harmonic Distortion (THD) to assess the overall issue. THD is the ratio of combined harmonic content to the fundamental frequency, expressed as a percentage. While most power quality analyzers calculate THD automatically, understanding how it’s derived helps you interpret the data more effectively.
Compare current THD with voltage THD. If current THD is significantly higher, the monitored load may be generating harmonics. If both values are similar, the load is likely responding to existing background distortion. Ideally, voltage harmonic effects should stay below 8% of the fundamental frequency. Exceeding this threshold requires further investigation. Remember, voltage distortion impacts the entire facility, while current distortion is usually load-specific and can lead to overheating, overloaded wiring, or tripped breakers.
Step 4: Identify Sources of Harmonics
Pinpointing the source of harmonics requires a methodical approach. Track harmonic currents downstream. In circuits without capacitors, these currents typically flow from non-linear loads back toward the substation via the path of least impedance. Use correlation analysis - compare time patterns of voltage THD with the operation of specific loads. A spike in voltage THD when a piece of equipment starts up is a strong clue.
Match your measurements with known harmonic profiles. For instance, computer loads often show a 3rd harmonic at 80% and a 5th at 60%. Six-pulse drives typically display a 5th harmonic at 20% and a 7th at 14%. If the dominant current harmonic is the 5th but the leading voltage harmonic is the 3rd, the load in question may not be the main source of voltage distortion.
If resonance is suspected, temporarily disconnect power factor correction capacitors during testing. A single large harmonic current in these capacitors often signals resonance with system impedance. When using techniques like Harmonic Power Flow Direction, confirm that current transformer (CT) polarity is correct; incorrect polarity can render results meaningless. For the most accurate source identification, consider time-synchronized measurements at multiple points around the PCC. This helps distinguish between harmonics generated by your facility and those originating from the utility side.
Power Quality and Harmonic Analysis | What Is 3-Phase Power? -- Part 7
Methods to Fix Harmonic Distortions
Addressing harmonic distortions effectively requires solutions tailored to the specific load characteristics, budget, and available space. Here's a breakdown of key methods to tackle harmonics.
Passive vs. Active Harmonic Filters
Harmonic filters come in two main types: passive and active, each with distinct advantages and limitations.
Passive filters rely on inductors and capacitors (LC circuits) to create a low-impedance path for specific harmonic frequencies, diverting them from the system. These filters are tuned to a single frequency, such as the 5th or 7th harmonic, making them ideal for fixed loads like pumps or fans. Costing between $50–$200 per kVAR, they are a budget-friendly option for predictable harmonic profiles. However, they are sensitive to grid changes, which can lead to resonance issues, potentially amplifying harmonics instead of reducing them.
Active filters, on the other hand, use power electronics such as IGBTs to monitor and inject counter-phase currents, effectively canceling harmonics in real time. They can handle multiple harmonic orders, up to the 50th, and are unaffected by grid imbalances or source impedance changes. Active filters are installed in parallel, providing redundancy - if one unit fails, the system continues to function. These filters are more versatile but come at a higher cost, ranging from $200 to $500 per kVAR.
"The industry has struggled to implement effective mitigation techniques... many suppliers using setups which are not meant for harmonic mitigation." - John Mitchell, Business Development Manager, CP Automation
For systems with fixed-frequency operations, passive filters are practical and cost-effective. However, for facilities with variable frequency drives (VFDs) or rapidly changing loads, active filters provide better performance. A 2024 case study comparing a 6-pulse drive system with active shunt filters to an Active Front End (AFE) system showed that the AFE resulted in 1,154,000 kWh of annual losses, while the active filter solution reduced this to 534,000 kWh - a 116% increase in energy waste for the AFE setup.
| Feature | Passive Filters | Active Filters |
|---|---|---|
| Cost | $50–$200 per kVAR | $200–$500 per kVAR |
| Harmonic Coverage | Limited to specific orders | Covers multiple harmonic orders |
| Adaptability | Fixed, tuned to frequencies | Adaptive, handles varying loads |
| Resonance Risk | High | Low |
| Ideal Applications | Fixed-frequency loads | Dynamic, variable conditions |
Using Line Reactors and Isolation Transformers
For additional harmonic reduction, line reactors and isolation transformers can complement filters.
Line reactors, also known as chokes, are 3-phase inductors installed on the input side of a drive. By adding impedance, they slow the DC bus capacitor's charging rate, extending the current draw period and reducing harmonic distortion. A 3% input choke can cut current harmonic distortion for PWM-type drives from about 80% to 40%. Installing a 2% to 5% line reactor in front of VFDs is a cost-effective way to reduce distortion and protect the drive's rectifier from transients. However, increasing the choke size beyond 3% yields diminishing returns.
Isolation transformers provide magnetic separation between the source and the load, offering higher impedance to harmonic currents. For circuits with heavy computer or electronic ballast loads, K-rated transformers (e.g., K-4, K-13, K-20) are recommended to prevent overheating caused by harmonic currents. The K-rating indicates a transformer's ability to handle harmonic-induced heating, with higher ratings offering greater tolerance.
Zig-zag transformers are particularly effective for managing zero-sequence (triplen) harmonics, such as the 3rd harmonic. These transformers create a low-impedance path to neutral, diverting these currents away from the supply. In commercial settings with high 3rd-harmonic loads, such as office equipment, zig-zag transformers near the load can prevent overloaded neutral conductors.
Another method involves phase-shifting configurations using transformers with specific connections (e.g., delta–wye or delta–delta). These setups enable 12-pulse or 18-pulse operations, which cancel out problematic harmonics like the 5th and 7th. For instance, a marine vessel with four 1,125 kVA generators and two 1,600 kW thrusters needed to reduce voltage total harmonic distortion (THD) below 8% to meet DNV/GL standards. Without compensation, THD ranged from 14.5% to 18%. An 18-pulse passive solution weighed 11,500 lbs and required 16 ft of space, while an active filter solution weighed 1,600 lbs and occupied just 4 ft of space.
Implementing Selective Harmonic Compensation
Selective harmonic compensation focuses on addressing specific harmonic orders rather than the entire spectrum. This approach is particularly useful for mitigating resonance at certain frequencies or meeting regulatory standards like IEEE 519.
Active harmonic filters in selective mode analyze load currents in real time, targeting specific harmonics (e.g., 5th, 7th, 11th). By injecting counter-phase currents for these frequencies, they reduce the filter's required current rating and overall footprint. For example, if the 11th harmonic causes resonance, the filter can be configured to focus on that frequency, optimizing both performance and cost.
"There is no point in reducing harmonic levels for its own sake; harmonics do not automatically mean problems." - Jonas Persson, Comsys AB
Modern active filters operate at efficiencies of 97% to 98.5% and can compensate for harmonics up to the 50th order. For best results, combine selective compensation with baseline measures like line reactors to address broader current distortion. This layered strategy ensures an efficient and cost-effective solution.
Verifying and Monitoring Harmonic Fixes
Once you've implemented mitigation measures, it's crucial to confirm their effectiveness through detailed testing and continuous monitoring.
Post-Mitigation Testing
Start by rechecking Total Harmonic Distortion (THD) levels at the Point of Common Coupling (PCC) and key equipment locations to ensure the measures worked as intended [2,13]. For accurate results, avoid average-responding meters and instead rely on true-RMS digital meters or power quality analyzers [10,13]. These tools provide precise readings of harmonic levels.
Use a Fast Fourier Transform (FFT) analysis to verify that targeted harmonics - such as the 5th and 7th - are now within acceptable limits [2,21]. Compare these new readings with your baseline data to measure the reduction in both THD and Total Demand Distortion (TDD) [2,19]. According to IEEE 519, compliance should be based on 95th percentile values over a weekly evaluation period, rather than instantaneous measurements. For systems operating at 69 kV or below, voltage THD should not exceed 5.0%.
Check the crest factor (the ratio of peak value to RMS), which should ideally be 1.414 for a pure sine wave. Significant deviations indicate lingering distortion. If you’ve installed filters to protect transformers, use a power quality analyzer to calculate the K-factor post-mitigation. This ensures the transformer’s heating effect remains within its rated capacity.
While initial verification is essential, ongoing monitoring is equally important to track long-term system performance.
Continuous Monitoring of Harmonic Levels
The trend in the industry is moving toward automated, real-time harmonic monitoring systems. These systems use data analytics to identify patterns and predict potential issues. Permanent monitors, which can be panel-mounted or fixed to DIN rails, are excellent for long-term tracking and continuous assessment. For high-precision tasks, revenue-grade meters (with 0.1% accuracy) offer advanced power quality functions.
When measuring harmonic currents, Rogowski coils are often preferred over traditional current transformers. They provide a wide bandwidth and avoid saturation, even when dealing with large conductors. Modern power quality analyzers should have a minimum sampling rate of 256 samples per cycle to capture disturbances accurately. Configure these systems to log 10-minute averages and 2-hour trends for a clear picture of system behavior over time [2,15].
"Guidance states that the voltage harmonic effects should be less than 8 percent relative to the fundamental. Values above the stated 8 percent should be investigated further." – Fluke
For a comprehensive understanding, collect baseline harmonic data over 1–4 weeks at consistent network points to capture peak operational scenarios [15,21]. If you're sourcing monitoring tools, platforms like Electrical Trader offer a variety of analyzers, Rogowski coils, and other equipment tailored for continuous harmonic monitoring.
These real-time insights help guide adjustments in the next phase to address any lingering issues.
Addressing Residual and Recurring Issues
Even after verifying improvements, some harmonic problems might persist. To tackle these, identify their source using a power quality analyzer. A positive harmonic power reading indicates distortion from the utility (upstream), while a negative reading suggests the issue originates from your equipment (downstream).
"A positive harmonic power reading suggests the distortion is coming from upstream. A negative reading indicates the harmonics are load-induced and generated by your equipment." – Jason Axelson, Power Quality Subject Matter Expert, Fluke
Investigate for resonance, as improperly tuned passive filters can sometimes amplify distortion instead of reducing it. Use thermal imaging to detect localized heating in transformers, neutral conductors, and bus bars - common signs of undetected triplen harmonics [13,22]. If overheating persists, consider replacing standard transformers with K-rated transformers like K-13 or K-20 [19,22]. For third harmonics affecting the neutral, zig-zag transformers can provide a low-impedance path for zero-sequence currents.
Rebalancing loads can help reduce neutral current and ease thermal stress on transformers. If residual harmonics remain, isolate sensitive equipment using dedicated branch circuits or isolation transformers [19,22]. Finally, set up real-time logging to catch emerging harmonic issues as load profiles evolve or new equipment gets added.
Conclusion
Summary of Identification Steps
Identifying harmonic distortions starts with collecting precise data using power quality analyzers at key locations. Measure both voltage and current waveforms, then apply a Fast Fourier Transform (FFT) to analyze the harmonic spectrum up to the 50th order. Calculate Total Harmonic Distortion (THD) and compare it to IEEE 519 standards - 5.0% for systems operating at 69 kV and below. Evaluate harmonic directionality: positive harmonic power readings often point to upstream utility issues, while negative readings suggest the problem originates from local loads. This detailed analysis provides the foundation for implementing targeted solutions.
Overview of Mitigation Techniques
After identifying the source of harmonic distortion, several effective solutions can be applied. Passive filters are an economical choice for addressing specific harmonic frequencies, while active filters are better suited for dynamic loads and broader harmonic ranges. Facilities with significant nonlinear loads can benefit from K-rated transformers, such as K-13 for computer-intensive environments or K-20 for data centers, to prevent overheating and extend equipment lifespan. Additionally, system improvements like load balancing or using zig-zag transformers to mitigate triplen harmonics can reduce distortion without requiring significant financial investment.
Final Recommendations
Long-term power quality depends on consistent monitoring and maintenance practices.
"Power quality surveys should be considered as routine maintenance and by making semi-regular measurements you can discover any changes that may be occurring so you can find potential problems and fix them early." – Fluke
Harmonic monitoring should be treated as an ongoing process, not a one-time solution. Regular power quality surveys are crucial for identifying and addressing emerging issues. Use true-RMS meters and power quality analyzers to ensure accurate readings. Keep detailed records of all system changes and update electrical diagrams regularly to track harmonic trends and correlate them with equipment modifications. For reliable monitoring tools, transformers, and filtering equipment, visit Electrical Trader. To maintain system health, ensure voltage harmonic levels remain below 8% of the fundamental frequency.
FAQs
What are the first signs my facility has harmful harmonics?
Early signs of harmful harmonics can show up in various ways. You might notice equipment overheating, intermittent operation, or control systems like PLCs malfunctioning. Other red flags include flickering lights, frequent breaker trips, overheating transformers, voltage distortions, and even insulation damage. Catching these issues early can save your facility from more severe electrical problems down the line.
How do I choose between a passive filter and an active filter?
If your harmonic levels are steady, predictable, and within a manageable range, and you're working with a tight budget, a passive filter is a solid choice. On the other hand, if your system deals with fluctuating harmonic conditions, needs to address a wide range of frequencies, or has complicated loads with multiple harmonic orders, an active filter is the better option. While passive filters are a more affordable solution for straightforward setups, active filters provide flexibility for more complex and dynamic systems.
Where should I measure to prove the harmonics are coming from my loads, not the utility?
To determine if harmonics are coming from your loads or the utility, take measurements at key points such as the distribution panel or directly at the load. Use equipment like true RMS meters or power quality analyzers to measure harmonic distortion. By comparing readings from the load side with those taken closer to the utility supply, you can pinpoint whether the issue originates within your system or from the utility.